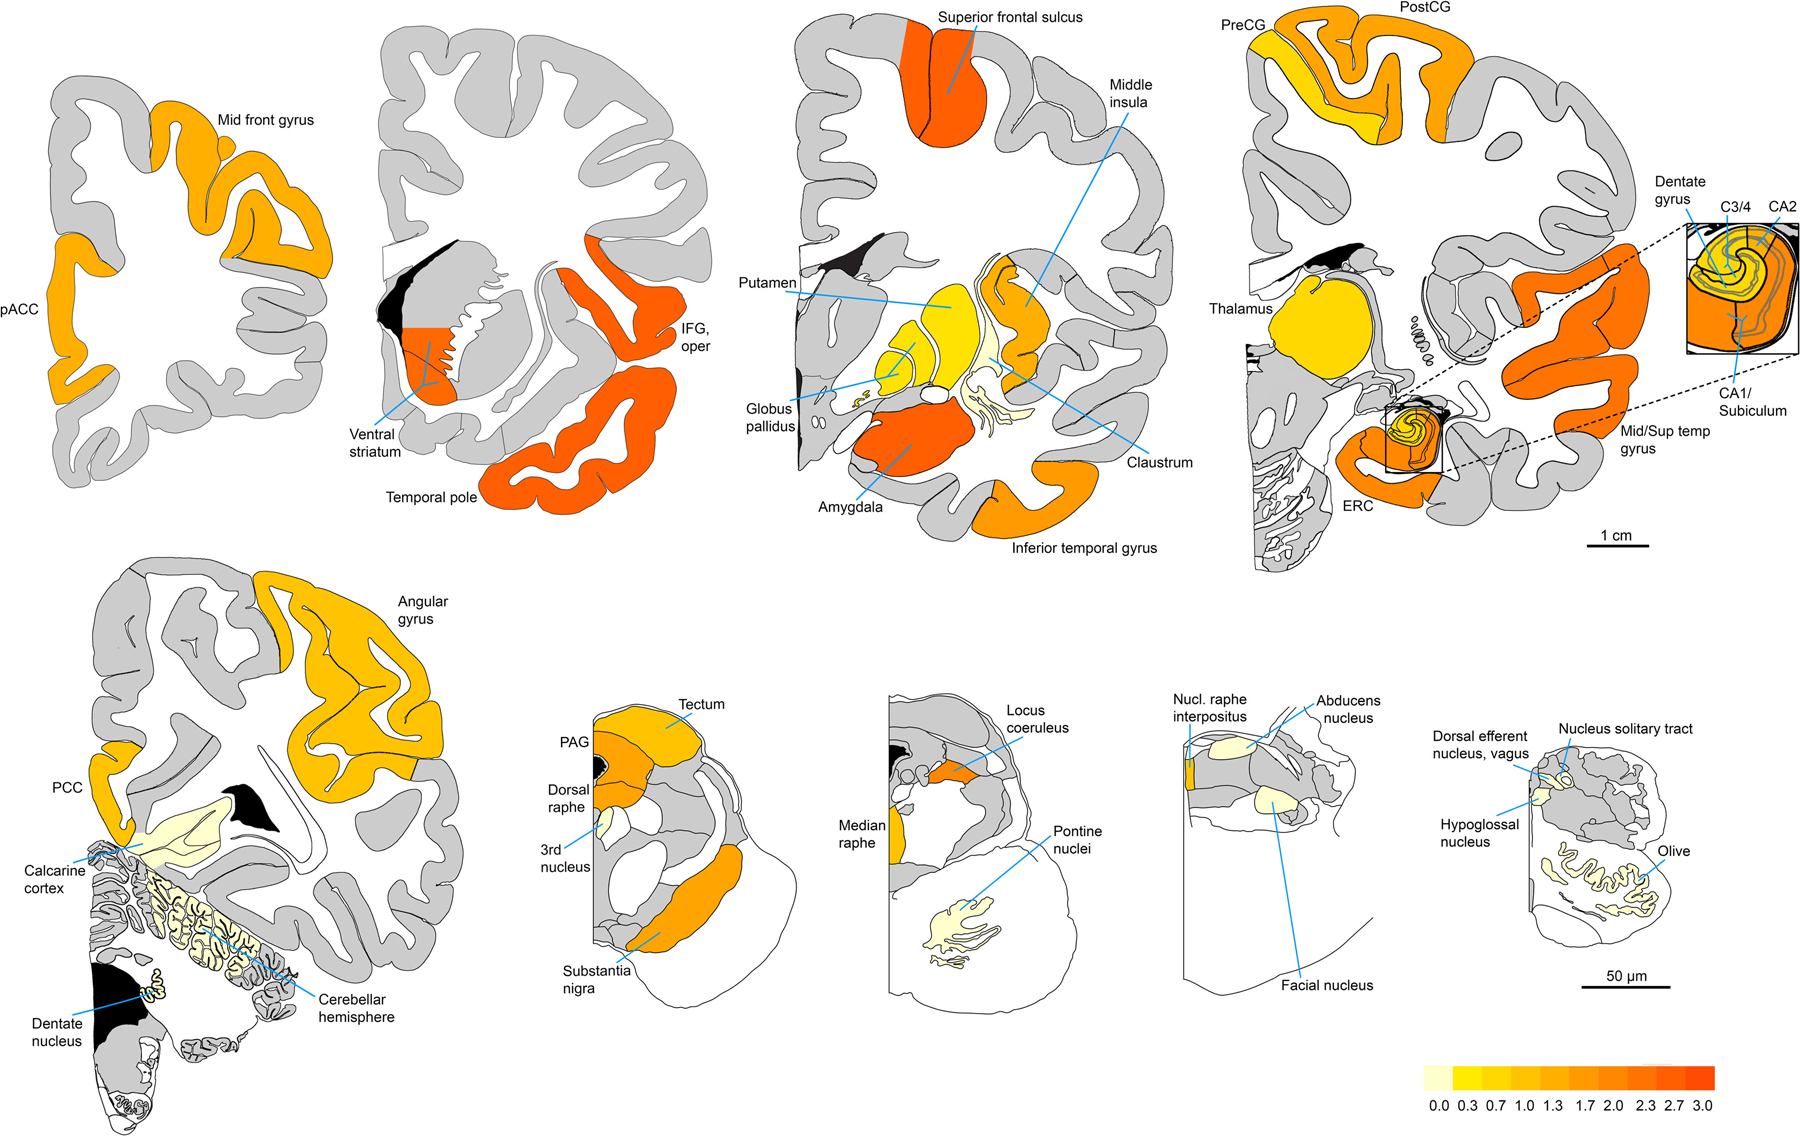
Fig. 2. TSC tauopathy most prominently involves neocortical and paralimbic fronto-temporal-insular regions, ventral striatum, and amygdala.

Heat map represents MAB359 (ac-tau, K274) immunoreactive NFT density averaged, region-wise, across the three subjects (TS 6, 7, and 10) with TSC tauopathy. The pattern emphasizes cortical, subcortical, and limbic regions and does not conform to the Braak NFT staging system. Figures are adapted mainly from sections 9, 18, 32, 54, and 82 of the Allen Human Brain Reference Atlas (atlas.brain-map.org), and from plates 10, 22, 30, and 34 of Olszewski and Baxter’s Cytoarchitecture of the Human Brainstem.
