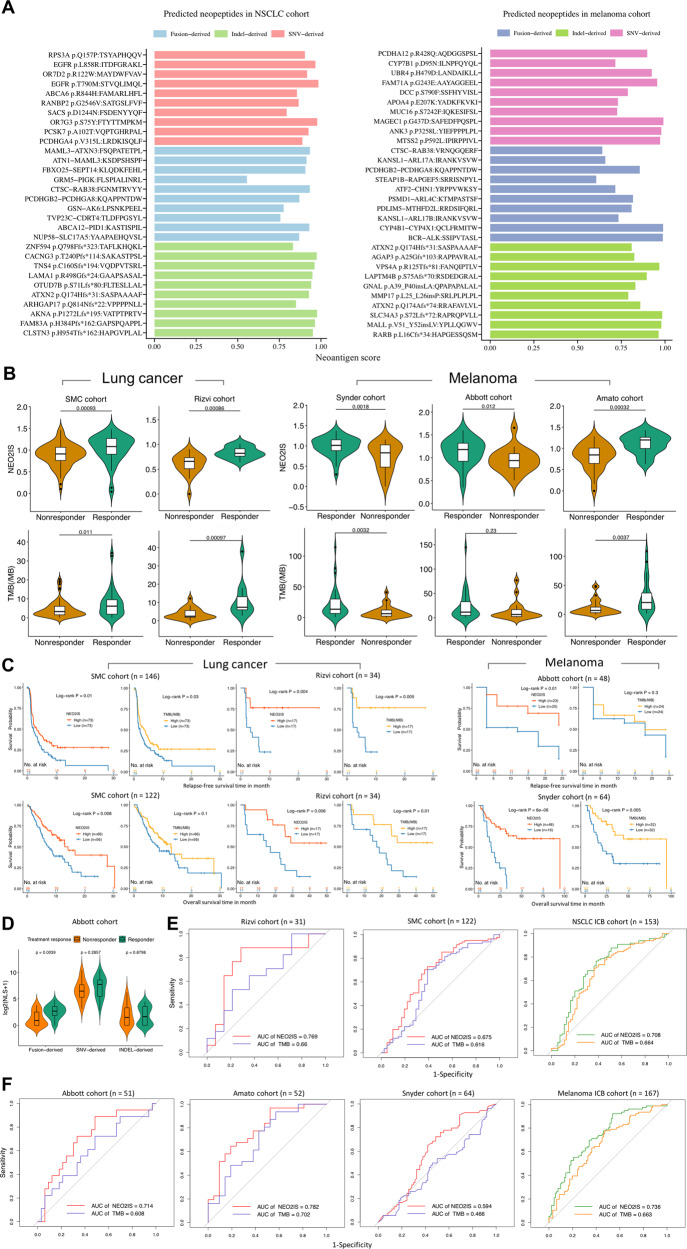
Fig. 3. Evaluation of immunotherapeutic efficacy in tumors using the neoantigen model.
A Overview of representative neoantigens detected in all NSCLC and melanoma samples from ICB cohorts. B The NEO2IS is significantly higher in responders compared with nonresponders (p value <0.05) and shows stronger association with treatment response than TMB in both lung cancers and melanomas. C Kaplan–Meier curves of RFS and OS in patients with high and low NEO2IS or TMB in lung cancer (left panel) and melanoma (right panel) ICB cohorts (quantiles or medians of cohort NEO2IS and TMB used as cut-off points). D Comparison of NLS between responding patients and nonresponding patients in Abbott melanoma cohort. E ROC curves for NEO2IS and TMB in 2 lung cancer cohorts and the combined NSCLC samples. F ROC curves for NEO2IS and TMB in 3 melanoma cohorts and their combined samples.

