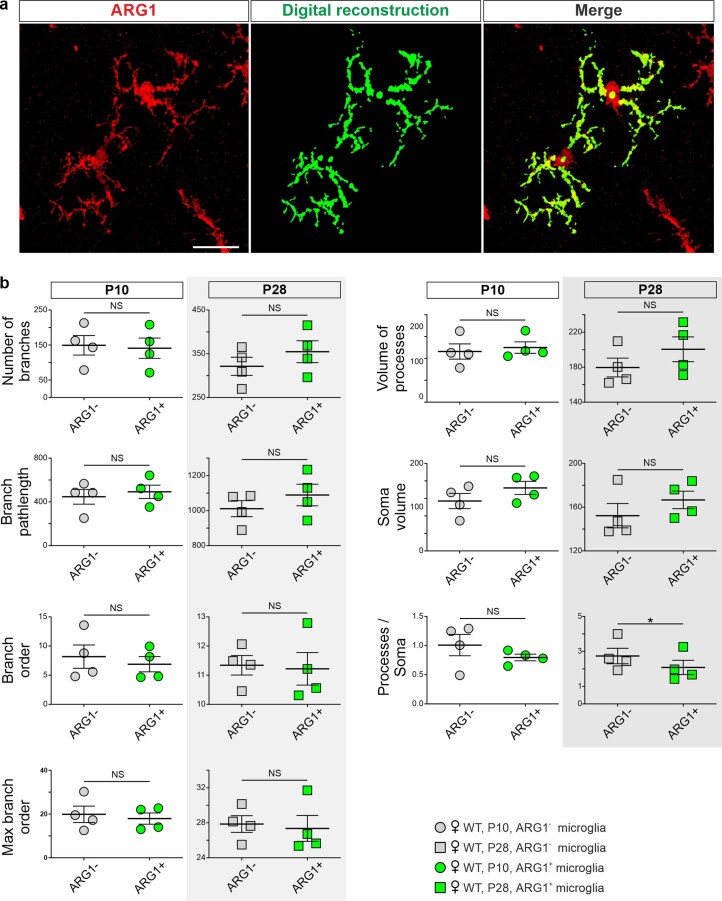
Extended Data Fig. 3. Morphometric comparison of P10 and P28 Arg1-negative-microglia versus Arg1+microglia from basal forebrain.
a, Illustration of digital reconstruction of two Arg1+microglia. b, Morphometric comparisons of Arg1+microglia and Arg1-negative-microglia from P10 and P28 mouse brain. Each circle or square represents data from a single animal (n = 4 female animals per group). P28, Processes/Soma, P = 0.0259. Scale bar, x = 10 μm, z = 15 μm. Data in b represented as mean ± s.e.m. Statistical significances were determined by paired two-sided t tests; *P < 0.05, n.s. indicates not significant.

