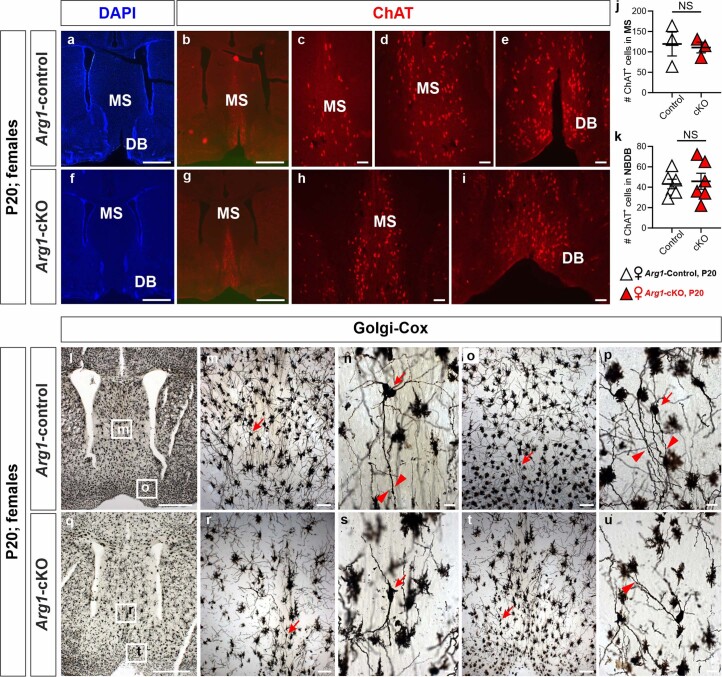
Extended Data Fig. 10. P20 female medial septum and Broca’s diagonal band do not show differences in number of ChAT positive neurons between Arg1-Control and Arg1-cKO brains.
a-i, Microphotographs of coronal sections of Arg1-Control (a-e and l-p) and Arg1-cKO (f-i and q-u) P20 forebrain. Choline acetyltransferase immunoreactive cells somata are uniformly distributed through the medial septum (MS; b-d and g-h) and the Broca’s diagonal band (DB; e and i). j-k, ChAT positive neuron cell count in MS and NBDN did not reveal differences between the two genotypes (j, n = 3 and k, n = 6 animals). l-u, Golgi-Cox method shows the morphology of the neurons of the medial septum (m-n and r-s) and the diagonal band of Broca (o-p and t-u). Dendrites with long spines (arrowheads) arose from fusiform or triangular-shaped neuronal bodies (arrows), and not differences between Arg1-Control and Arg1-cKO neurons are evident. Microphotographs a and f are DAPI counterstained to help in the identification of anatomical landmarks. Low magnification l and q microphotographs illustrate the medial septum (squares, m and r) and the diagonal band of Broca (squares, o and t) areas. Scale bars, 1000 µm (a, f, l and q), 100 µm (b, c, g, h, m, o, r, t), and 20 µm (d, e, h, i, n, p, s, u). Data in j and k are in mean ± s.e.m. Statistical significances were determined by unpaired two-sided t tests. n.s. indicates not significant.

