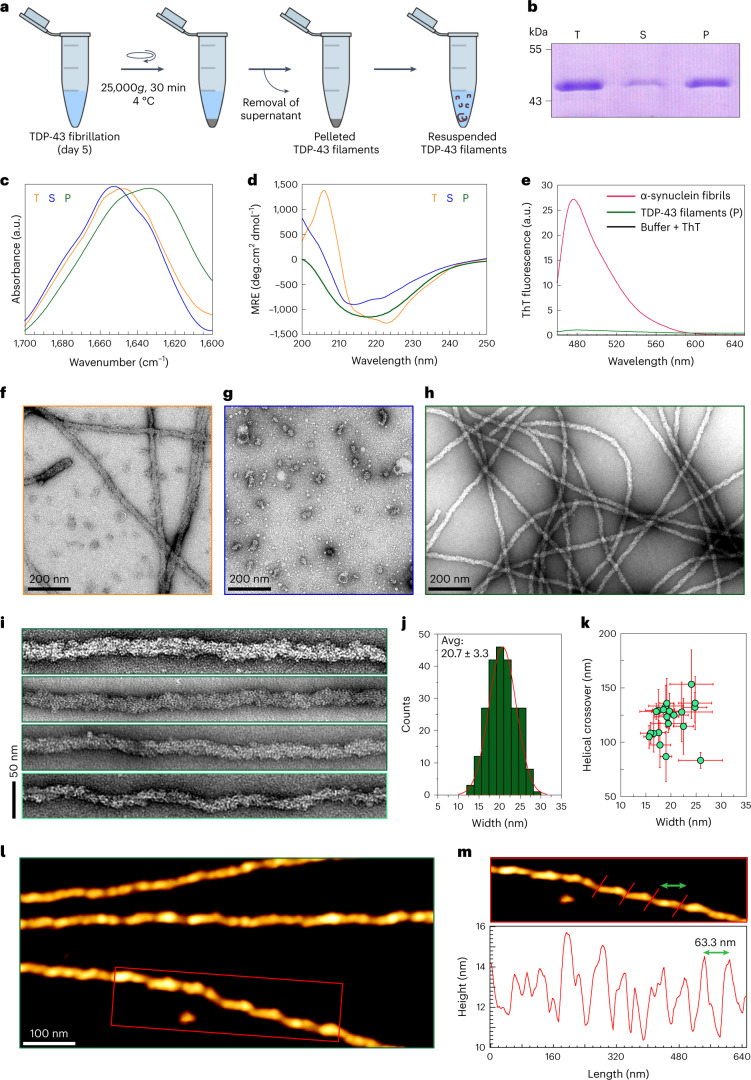
Fig. 1. Preparation of FL TDP-43 filaments and structural characterization.
a, Schematic of the protocol used to isolate TDP-43 filaments from 200-TDP-43. b, Coomassie staining of total (T), supernatant (S) and pellet (P) fractions after 5 d of TDP-43 fibrillization. c,d, Amide I spectra and CD spectra of T, S and P fractions. e, ThT fluorescence spectra of resuspended TDP-43 filaments (green), αSyn fibrils (red) or ThT alone (black). f–h, EM images of T (f), S (g) and resuspended P fraction (h). i, EM images of single FL TDP-43 filaments at a magnified view. j, Distribution of TDP-43 filaments (n = 232) width quantified using the EM images. The red line indicates the Gaussian fit from the width distribution. k, Helical crossover of FL TDP-43 filaments plotted against their corresponding widths with error bars. A single green circle represents the mean values obtained for the helical crossover distance and width of one filament. Error bars represent the s.d. (n = 21, number of filaments analyzed from three independent experiments). l, AFM images of individual TDP-43 filaments. m, Magnified AFM image (red box in l) showing the helical twists of TDP-43 filaments with rendering red lines. The respective periodicity profile along the fibril axis is shown below with the distance between two peaks marked by a green double-headed arrow. a.u., arbitrary units.

