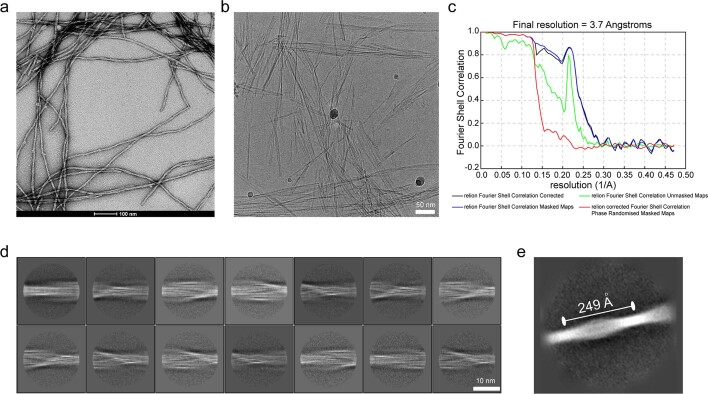
Extended Data Fig. 5. Cryo-EM analysis of CP fibrils.
a) Representative TEM image (left) and b) raw cryo-EM image (right) of fibrils from CP (scale bars: for TEM is 100 nm and for cryo-EM is 50 nm). c) Fourier shell correlation curves from RELION between the two independently refined half-maps. d-e) Representative 2D class average images of CP segments (d) and large extracted CP segment (e) with visible helical crossover and corresponding half-pitch distance of 249 Å.

