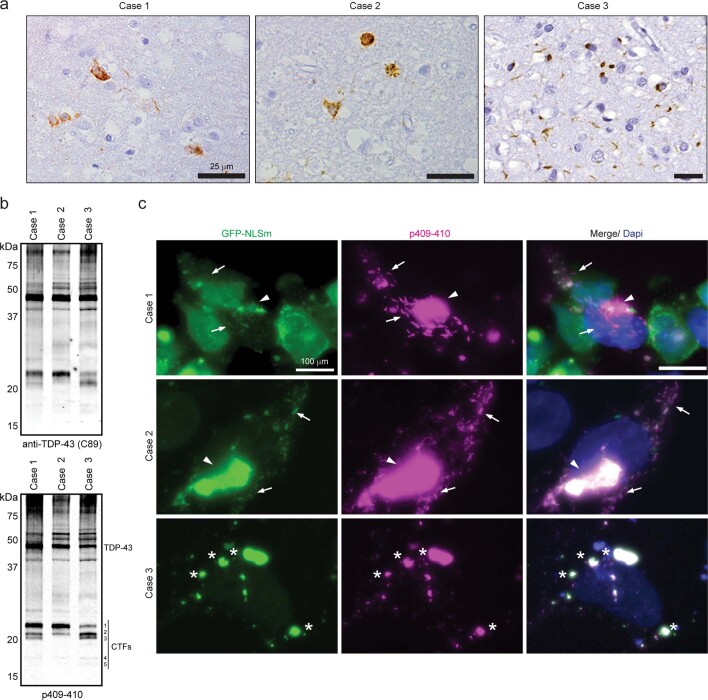
Extended Data Fig. 8. Characterization of the three ALS/TFLD-TDP cases used in this study.
a) Representative photomicrographs of p409-410 immunostaining in frontal cortex sections of three different ALS/FTLD-TDP cases used in the study. Scale bar=50 µm. b) Immunoblot analysis of the sarkosyl-insoluble fractions obtained from the frontal cortex using a pan-TDP43 antibody (C89) and a phosphorylation-specific TDP-43 specific antibody (p409-410). Molecular weight markers in kDa are shown on the left and the position of full-length TDP-43 protein (TDP-43) and C-terminal fragments CTFs (bands #1, #2, #3, #4, and #5) are shown on the right. c) Representative ICC images of GFP-NLSm expressing cells (green and merge) transduced with sarkosyl-insoluble brain extracts analyzed in b) (that is, cases 1, 2, and 3) at 3 days post-transduction showing 1% Triton-insoluble phospho-TDP-43-positive cytoplasmic aggregates (p409-410, magenta, and merge). In case 1 and case 2, transduced cells’ arrows point to small linear, straight, and wavy aggregates, and the arrowhead points to bigger heterogeneous filamentous aggregates. On the other hand, asterisk labels in cells transduced with the sarkosyl-insoluble brain (from case 3) reveal the formation of round and spherical phosphorylated aggregates. Cells were counterstained with DAPI to label the nuclei (blue). Scale bar=20 µm. All experiments were repeated at least 3 times.

