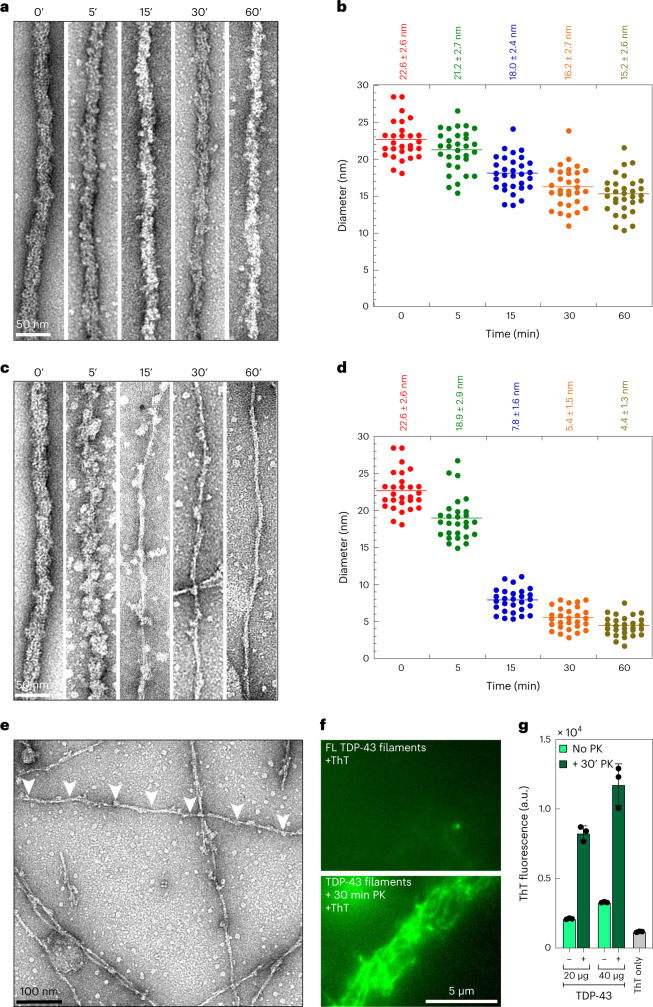
Fig. 3. Limited proteolysis of FL TDP-43 filaments exposed the amyloid core through the thinning of fibril diameter.
a,b, Representative EM images of trypsin-treated TDP-43 filaments at different time points (a) and dot plots representing their respective diameters (b). c,d, Representative EM images of PK-treated TDP-43 filaments at different time points (c) and plots representing their respective diameters (d). For b and d, each dot represents the diameter of a single filament with n = 28–31 filaments analyzed from each time point over three independent experiments. e, EM image of 30-min PK-treated TDP-43 filaments showing the twists and periodicity from the amyloid core (white arrowheads). f, TIRFM images of ThT signal of FL TDP-43 filaments with no PK (top) and after PK treatment for 30 min (bottom). g, Quantification of ThT fluorescence before and after treatment of FL TDP-43 filaments at the normalized concentration. Data represent the mean ± s.d., n = 3 from a minimum of three independent experiments.

