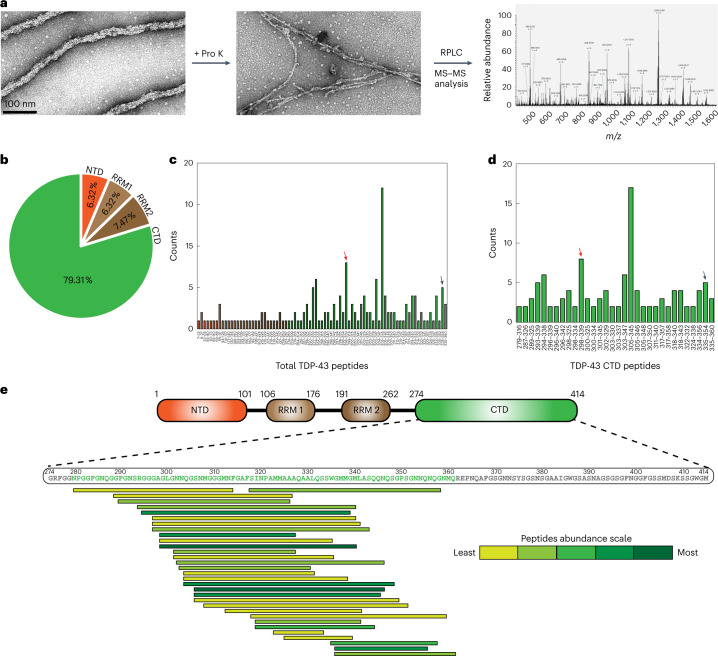
Fig. 4. LC–MS/MS of proteinase K-unmasked TDP-43 filaments.
a, TDP-43 filaments before and after PK treatment identifying the stable fibrillar core and its following LC–MS/MS analysis. b, Pie chart showing the percentage of identified peptides covering the whole region of TDP-43. c,d, Bar diagrams showing the sequence numbering of peptides identified from MS–MS analysis and their repeat counts for total peptides (c) and peptides from the CTD of TDP-43 (d). The red and black arrows show the highly abundant peptides P1 (298–339) and P2 (335–354), respectively. e, Sequence and repeat details of CTD peptides showing the region of amino acids 279–360 (green) as the fibrillar core of TDP-43 filaments. RPLC, reversed-phase liquid chromatography.

