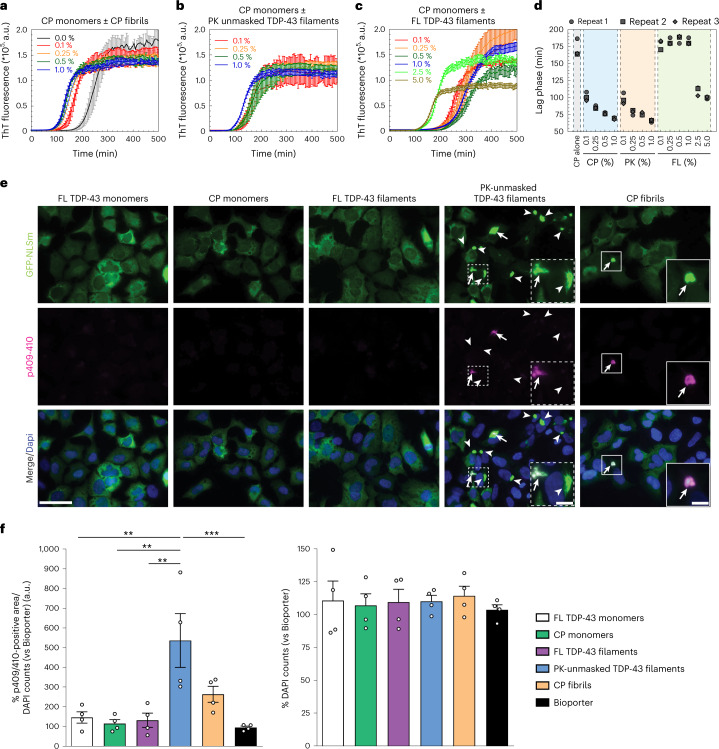
Fig. 6. Unmasking the core of FL TDP-43 filaments enhances their uptake and seeding activity.
a–c, Aggregation kinetics of CP monomers monitored by ThT fluorescence in the absence and presence of varying concentrations of CP fibrils (a), PK-unmasked TDP-43 filaments (b) and FL TDP-43 filaments (c) used as seeds. Averages of three traces are shown as solid lines in all the samples. All figures show ThT intensity as a function of time (non-normalized raw data). d, Measurement of the lag phase of all the samples from a–c. Data are shown as the mean ± s.d., n = 3 independent experiments. e, Representative fluorescence images of ICC analysis using the p409–410 antibody (red and merge) in GFP-NLSm-expressing cells (green and merge) transduced with FL TDP-43, CP monomers, FL TDP filaments, PK-unmasked TDP-43 filaments and CP fibrils, at 3 d.p.t. Arrows point to p409–410-positive GFP-NLSm aggregates; arrowheads point to non-phosphorylated GFP-NLS aggregates. Cells were counterstained with DAPI to label the nuclei. Scale bars, 50 µm and 10 µm (insets). f, Plots show the quantification of the percentage area occupied by p409–410 staining (left plot) at 3 d.p.t. measured in e and the number of DAPI counts (percentage; right plot). Bar plots show the mean, and whiskers are the s.e.m., with individual points representing a different experimental replica (n = 4). A one-way analysis of variance (ANOVA) followed by Tukey’s multiple-comparisons test was used for the analysis; left plot, P = 0.0006, F(5,18) = 7.433. **P < 0.01, ***P < 0.001.

