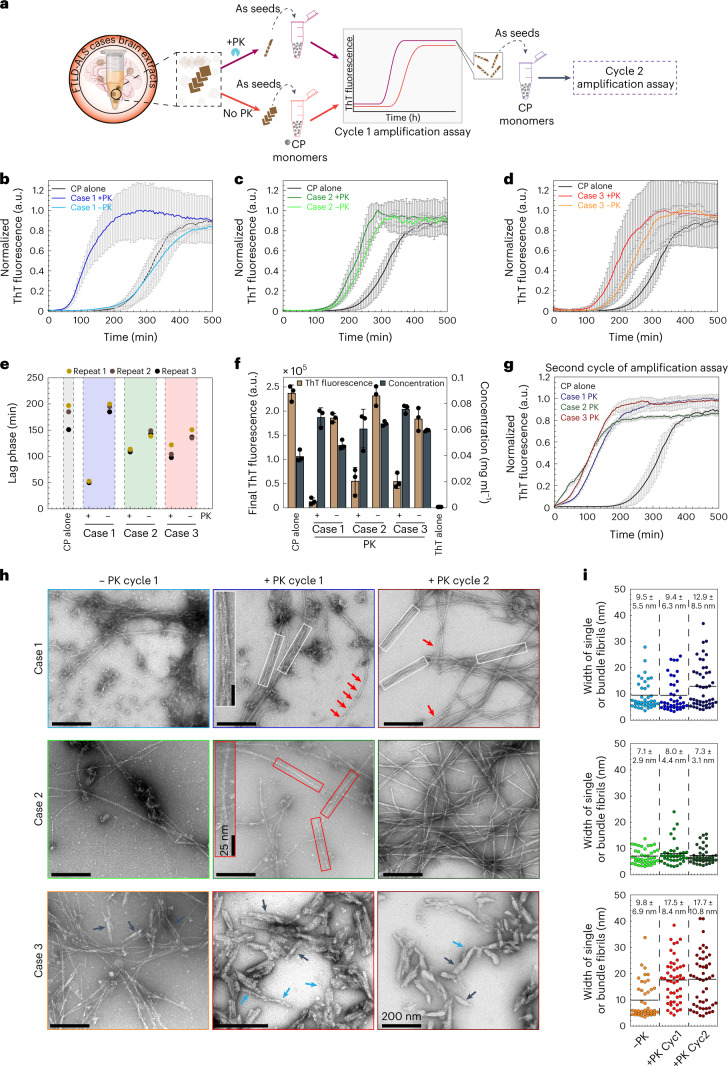
Fig. 7. Exposure of the amyloid core boosts seeding of brain-derived TDP-43.
a, A schematic depiction of the workflow of the aggregation kinetics of CP monomer seeding with brain-derived TDP-43 extracts treated with or without the PK treatment. b–d, ThT fluorescence-based first cycle seeding assay of CP monomers in the absence or presence of PK-untreated (−PK) or treated (+PK) brain extracts from three cases (1–3). Solid lines represent means from three independent repeats and error bars show the s.d. e, Dot plot showing the lag phase of aggregation curves estimated from b–d. f, Bar graph displays the mean of final ThT fluorescence and concentration of protein sedimented at the kinetic end time point of all the samples from b–d. The graph represents the mean ± s.d. of three independent experiments. g, The second cycle of ThT-based fluorescence seeding assay of CP monomers re-seeded with end time point aggregates from (+PK) brain extracts of all three cases (1–3) from b–d. Solid lines represent means from three independent repeats and error bars indicate the s.d. h, EM images from the endpoint of the first cycle (a–c) and second cycle (g) aggregation assays of samples seeded with PK-untreated (−PK) and PK-treated (+PK) brain extracts from the first cycle seeding assay (−PK and +PK cycle 1) and also from the second cycle seeding assay (+PK cycle 2). White rectangular boxes display the fibrils appearing as bundles. Red and blue arrows show the single fibrils, and black arrows present the short and sturdy fibrillar morphologies. i, Dot plots showing the distribution and average of the width of single and bundled fibrils measured from all the images from f. Each dot represents the diameter of a single filament with n = 40–48 numbers of filaments analyzed for each sample from h over three independent experiments.

