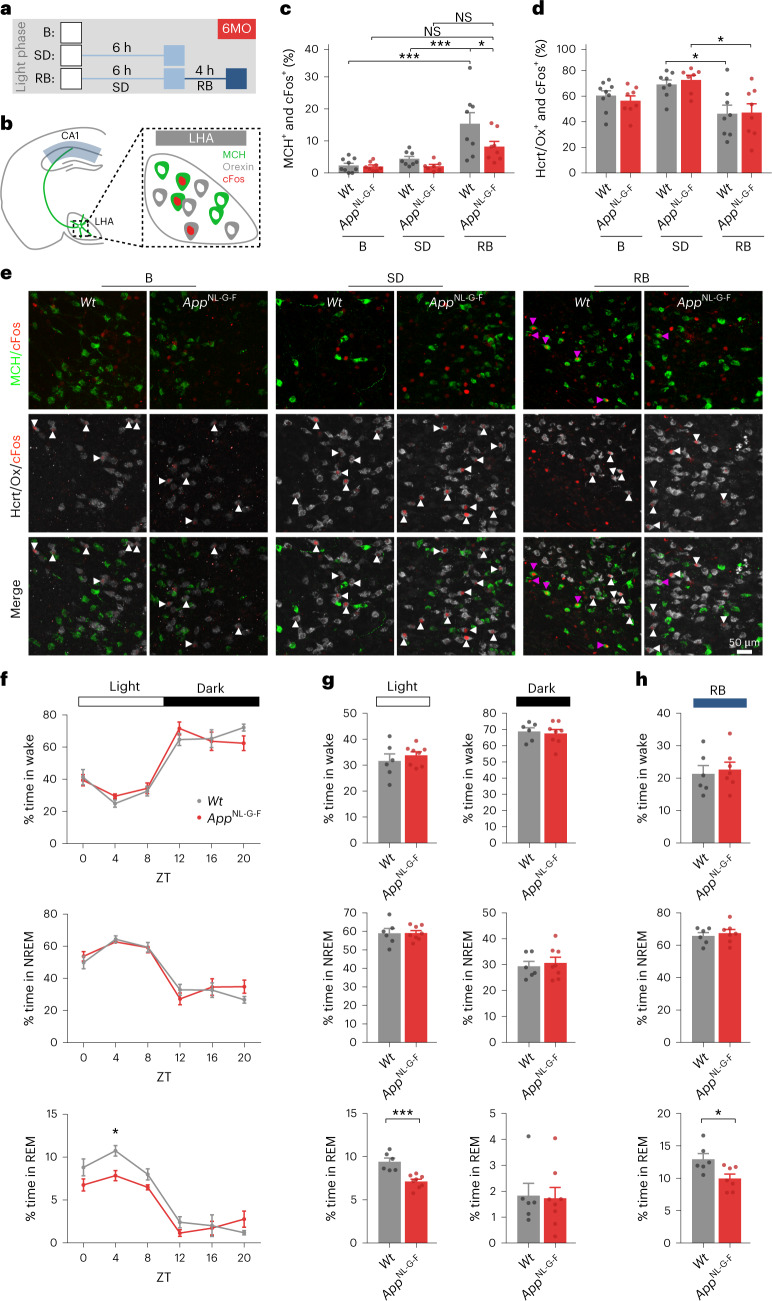
Fig. 4. Reduced fraction of active MCH neurons and perturbed rapid eye movement sleep in AppNL-G-F mice.
a, Schematic of experimental groups at 6 months: control (B), 6 h of SD, and 4 h of RB sleep following 6 h of SD. b, Location of analyzed neurons. c,d, Quantifications of LHA neurons from Wt and AppNL-G-F mice. c, MCH+ and cFos+ (Wt B versus Wt RB P = 0.0001, Wt SD versus Wt RB P = 0.0004, Wt RB versus AppNL-G-F RB P = 0.0448). d, Hcrt/Ox+ and cFos+ (Wt SD versus Wt RB P = 0.0354, AppNL-G-F SD versus AppNL-G-F RB P = 0.0126). Number of mice: 6 MO - B: Wt n = 9, AppNL-G-F n = 8; SD: Wt n = 8, AppNL-G-F n = 7, RB: Wt n = 8, AppNL-G-F n = 8. One-way analysis of variance (ANOVA) with Tukey’s post hoc test. Individual data points are shown; bars represent the mean ± s.e.m. (*P < 0.05, ***P < 0.001). e, Representative images of LHA show MCH (green) or Hcrt/Ox (gray) neurons positive for cFos (red). Magenta arrowheads denote MCH+ and cFos+; white arrows denote Hcrt/Ox+ and cFos+ neurons. f,g, Basal EEG/EMG recordings show the percentage of time spent in wake, NREM and REM states over Zeitgeber time (ZT; every 4 h; P = 0.0192; f) or during total light and dark phases (P = 0.0004; g). Number of mice: 6 MO - B: Wt n = 6, AppNL-G-F n = 8. Two-way ANOVA, with Holm–Sidak post hoc multiple-comparisons test. Individual data points are shown; bars represent the mean ± s.e.m. (*P < 0.05). h, EEG/EMG recordings during RB sleep show the percentage of time spent in wake, NREM or REM (P = 0.0214). Number of mice: 6 MO - RB: Wt n = 6, AppNL-G-F n = 7. Two-tailed unpaired t-test. Individual data points are shown; bars represent the mean ± s.e.m. (*P < 0.05).

