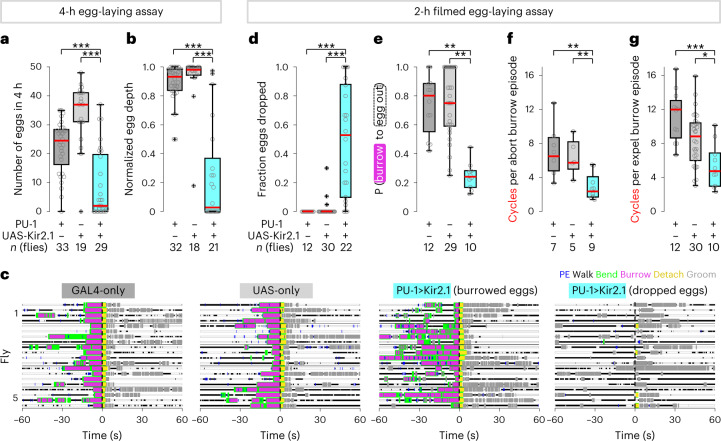
Fig. 6. Silencing PU neurons reduces egg output and disrupts the egg-laying sequence.
a, Number of eggs released on a 1% agarose substrate in 4 h (n = 33, 19 and 29 flies per group). Here and in b and d–g, box bounds indicate the 25th and 75th percentiles, the red lines indicate the medians, and the whiskers indicate the 5th and 95th percentiles; o, data from individual flies; +, outliers; *P < 0.05; **P < 0.01; ***P < 0.001. Data were analyzed by two-sided Wilcoxon rank-sum test followed by a Bonferroni correction (Supplementary Table 7). b, Average normalized depth of penetration of released eggs (n = 32, 18 and 21 flies per group). c, Representative ethograms of egg-laying behavior for genetic control flies (first and second graphs) and for PU-silenced flies (third (burrowed eggs) and fourth (spontaneously dropped eggs) graphs). Each ethogram depicts data from five flies (n = 4 events per fly); t = 0, egg out. d, Fraction of eggs spontaneously dropped without burrowing (n = 12, 30 and 22 flies per group). Only flies that released four or more eggs are considered here and in e–g. e, Average probability (P) of progression from burrowing to egg out (n = 12, 29 and 10 flies per group). Only flies that exhibited three or more burrowed eggs are considered. f, Average number of cycles per aborted burrowing episode (n = 7, 5 and 9 flies per group). Only flies that exhibited three or more aborted burrowing episodes are considered. g, Average number of cycles per egg expulsion burrowing episode (n = 12, 30 and 10 flies per group). Only flies that exhibited three or more egg expulsion burrowing episodes are considered.

