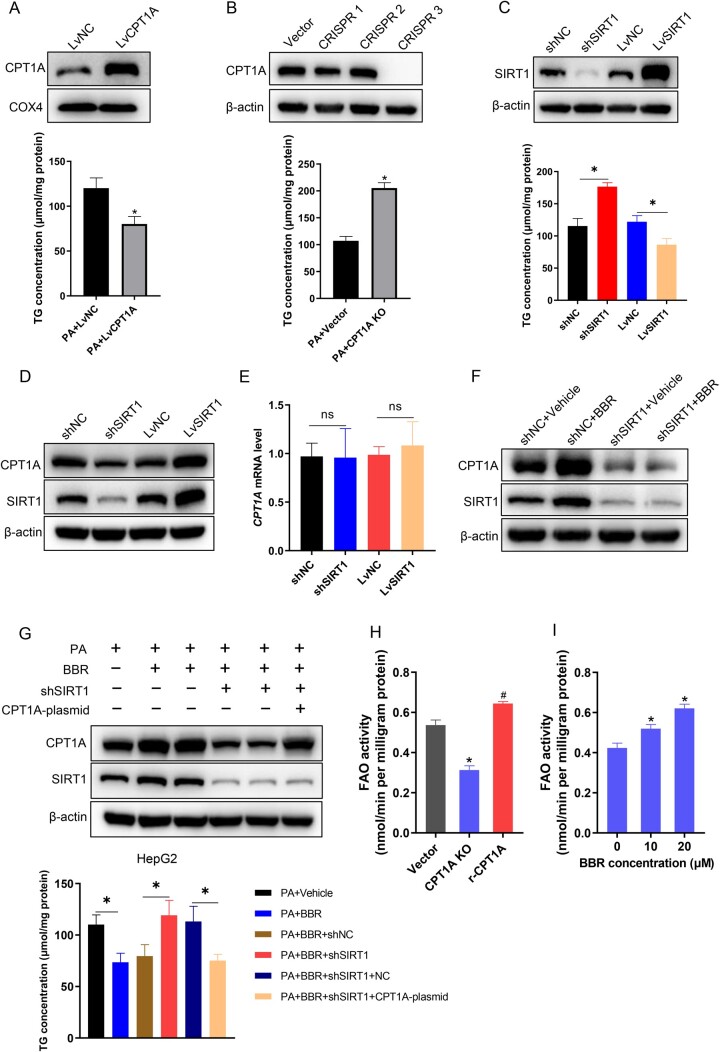
Figure 6.
SIRT1 mediates the effect of BBR on decreasing TG accumulation and increasing fatty acid oxidation via CPT1A in hepatocytes. (A) TG concentrations of CPT1A overexpressing HepG2 cells treated with PA (250 μM). (B) TG concentrations of CPT1A knockout HepG2 cells treated with PA. (C) Quantitative analysis of TG concentrations in SIRT1 knock-down and overexpression HepG2 cells induced by PA. (D) The expression levels of CPT1A in SIRT1 knock-down and overexpression HepG2 cells were identified by using Western blot analysis. (E) The mRNA levels of CPT1A in shSIRT1- or LvSIRT1-transfected HepG2 cells. (F) Representative images of CPT1A and SIRT1 in shNC or shSIRT1 HepG2 cells treated with or without BBR. (G) Quantitative analysis of the TG contents and representative images of CPT1A and SIRT1 expression levels in PA-treated shNC or shSIRT1 HepG2 cells with or without BBR or CPT1A plasmids treatment. (H) Fatty acid oxidation was computed in PA (250 μM)-treated CPT1A knockout cells and the knockout cells transfected with restored CPT1A wild-type synonymous mutant plasmid. (I) Fatty acid oxidation assay of HepG2 cells treated with PA (250 μM) and different concentrations of BBR (0, 10, 20 μM). Results are representative of three independent experiments; data are provided as means ± SD; *P < 0.05 (compared with the control group); #P < 0.05 (compared with the CPT1A knockout group). BBR, berberine; TG, triglyceride; PA, palmitate; NC, normal control; sh, short hairpin; Lv, lentivirus; KO, knockout; FAO, fatty acid oxidation.

