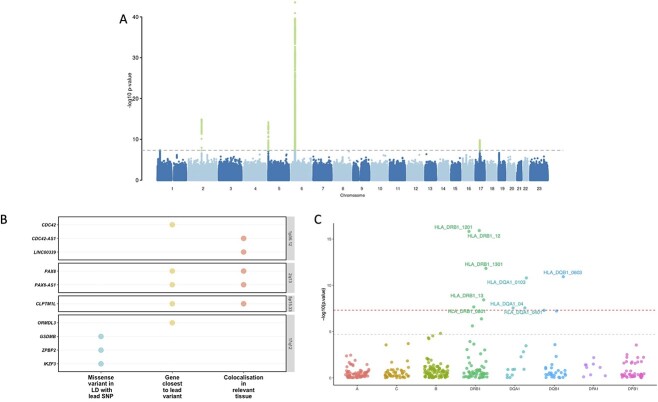
Figure 1.
Genome wide association study for cervical cancer, gene prioritisation and HLA fine-mapping. (A) Manhattan plot of cervical cancer GWAS meta-analysis. (B) Visualised evidence for cervical cancer GWAS meta-analysis candidate gene mapping (showing only genes with at least one level of evidence). We considered the following criteria when selecting the most likely candidate genes—(a) whether the lead signal is in LD (r2 > 0.6) with a coding variant in any of the nearby genes, (b) which is the closest gene to GWAS lead variant in each locus and (c) is there significant (PP > 0.8) colocalisation in relevant tissues (tissues similar to female reproductive tract tissues based on cellular composition and gene expression (vagina, uterus, oesophagus mucosa and gastro-oesophageal junction, sigmoid colon, skin, salivary gland and tibial nerve). (C) HLA alleles associated with cervical dysplasia. The y-axis shows the -log10 P-values from analysis of 10 446 cases and 81 586 controls in the EstBB using SAIGE. The red dashed line represents the genome-wide significance threshold (P < 5  10−8), whereas the grey line represents the P-value threshold adjusted for the number of tested alleles (P < 2.0
 10−5).

