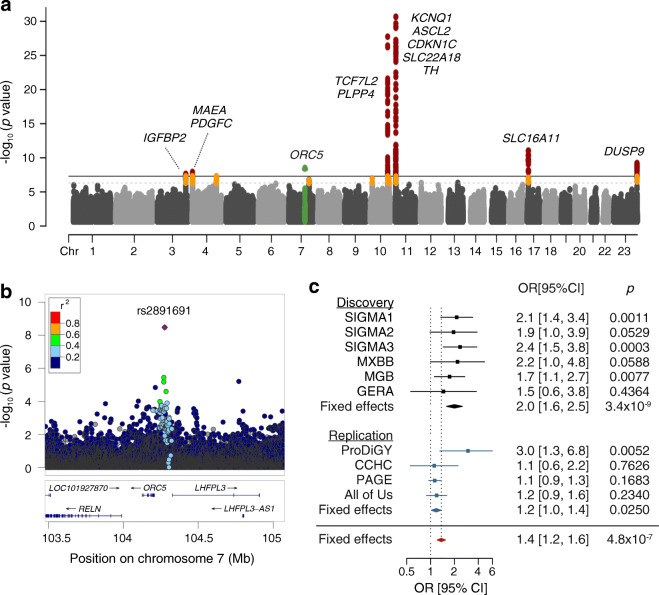
Fig. 3.
Type 2 diabetes GWAS meta-analysis in the Latino population. (a) Manhattan plot of the meta-analysis association statistics, highlighting the loci with genome-wide significance (red) or sub-genome-wide significance (orange) for type 2 diabetes. (b) Regional association plot of the novel ORC5/LHFPL3 locus associated with type 2 diabetes risk. (c) Forest plot of the GWAS association statistics for the novel ORC5/LHFPL3 locus in the discovery (black), the replication (blue) and overall (red) cohorts

