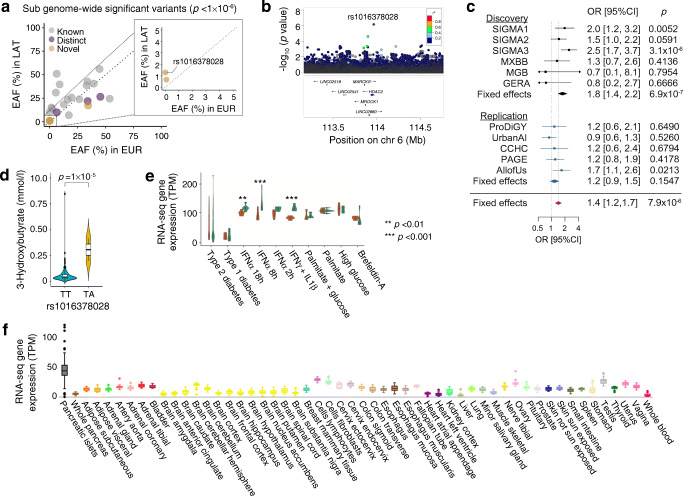
Fig. 4.
Sub-genome-wide significant HDAC2 novel type 2 diabetes loci. (a) Scatter plot of the effect allele frequencies (EAFs) from the sub-genome-wide significant variants in Latino (LAT) vs European (EUR) populations, highlighting those that are distinct from the known lead type 2 diabetes-associated variants (purple) and those that are in novel loci (yellow). (b) Regional association plot of the novel HDAC2 locus associated with type 2 diabetes risk. (c) Forest plot of the association statistics in the discovery (black) and the replication (blue) cohorts. (d) Violin plots of serum 3-hydroxybutyrate levels in non-carriers (blue) and carriers (yellow) of the rs1016378028 variant. Whiskers range from upper and lower fences (1.5 × IQR); points represent outliers. (e) HDAC2 gene expression in human islets from donors with type 1 and type 2 diabetes and control islets treated (brown) or not (green) with different cytokines or other stressor compounds. **p<0.01, ***p<0.001 vs no treatment (adjusted p values, Benjamini–Hochberg correction). Whiskers range from upper and lower fences (1.5 × IQR); points represent outliers. (f) HDAC2 gene expression in multiple tissues from GTEx and TIGER portals. Each box plot shows expression in a different tissue or cell line Whiskers range from upper and lower fences (1.5 × IQR); points represent outliers

