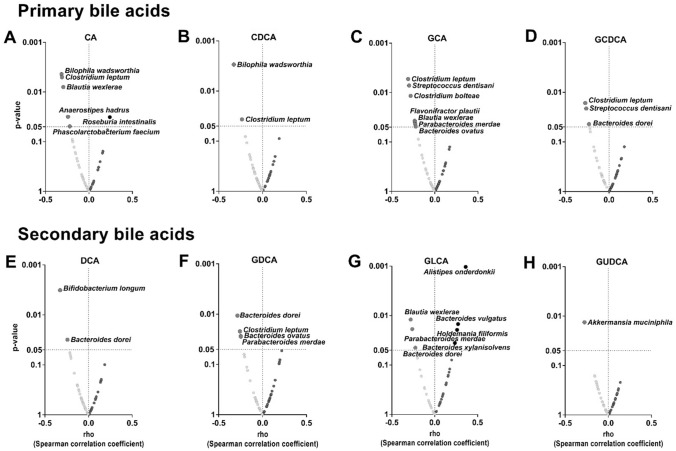
Fig. 3.
Volcano plots showing Spearman correlation between fecal microbiota composition at species taxonomic level and plasma levels of bile acids. The X-axis represents Spearman’s correlations coefficients, whereas the Y-axis represents the P-value of the correlations. Red circles indicate negative correlations, whereas blue circles indicate positive correlations. Only those correlations that achieved the significant threshold (P < 0.05) were annotated with the name of the species. CA cholic acid; CDCA chenodeoxycholic acid; DCA deoxycholic acid; GCA glycocholic acid; GCDC glycochenodeoxycholic acid; GDCA glycodeoxycholic acid; GLCA glycolithocholic acid; GUDCA glycoursodeoxycholic acid

