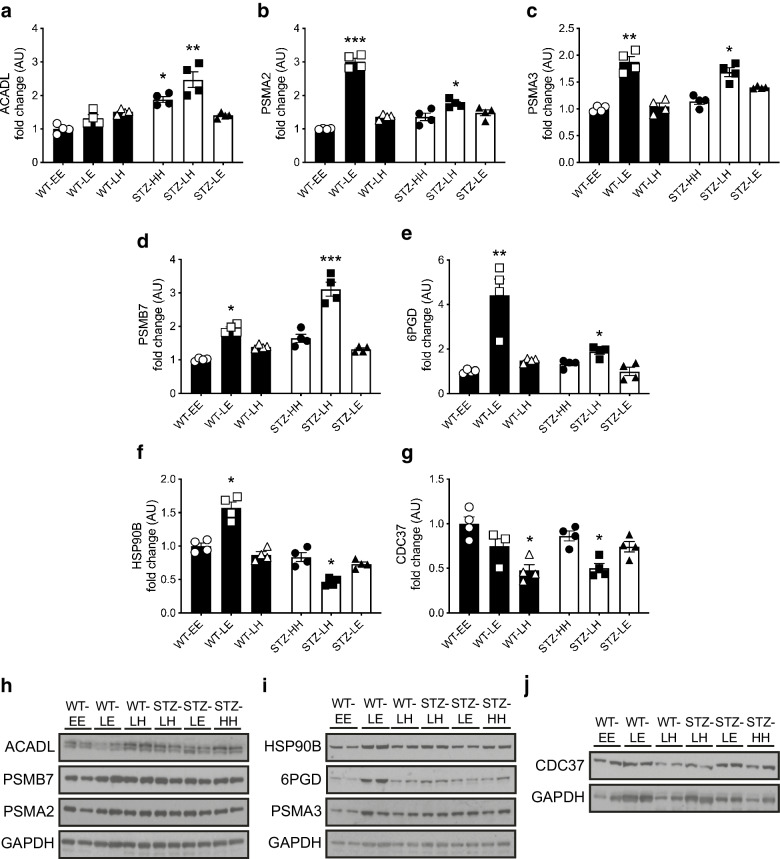
Fig. 3.
Effect of glycaemic variability on SILAC-outcome selected protein levels in the hippocampus of WT control and STZ-diabetic mice. (a–g) Hippocampal protein levels (ratio of signal intensities to control euglycaemia [WT-EE] data) in mice exposed to an acute hypoglycaemic episode from a euglycaemic (WT control mice, black bars) or hyperglycaemic (STZ-diabetic mice, white bars) baseline and returned to euglycaemia or hyperglycaemia: ACADL (a); PSMA2 (b); PSMA3 (c); PSMB7 (d); 6PGD (e); HSP90B (f); and CDC37 (g). (h–j) Representative immunoblots of ACADL, PSMB7 and PSMA2 (h), HSP90B, 6PGD and PSMA3 (i), and CDC37 (j) and their respective GAPDH loading controls. Results represent mean values ± SEM. *p<0.05, **p<0.01, ***p<0.001 (Kruskal–Wallis one-way ANOVA followed by Dunn’s multiple comparisons test). E, euglycaemia; H, high, hyperglycaemia; L, low, hypoglycaemia

