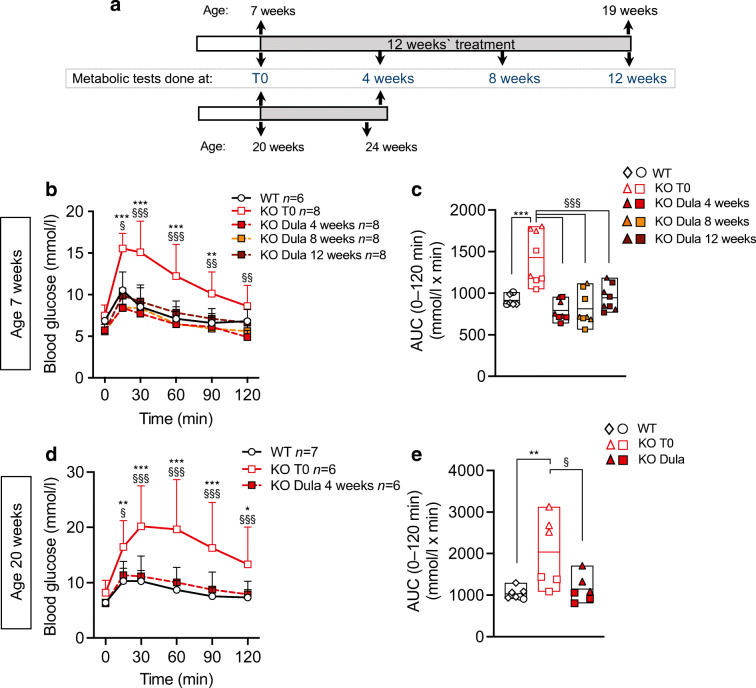
Fig. 2.
Dulaglutide treatment reverses diabetes in WFS1-deficient mice. (a) Schematic representation of the experiment. Seven-week-old (n=8) (b, c) or 20-week-old (n=6) (d, e) Wfs1 KO mice were treated for 4–12 weeks with dulaglutide (1 mg/kg every 4 days) and compared with age-matched WT littermates. (b, d) IPGTT glucose levels and (c, e) AUC of WT mice and dulaglutide-injected Wfs1 KO mice at baseline (T0) and after 4, 8 and 12 weeks of treatment. Results are expressed as mean and SD. In the bars circles and squares represent individual female mice, triangles and diamonds male mice. Extremities of floating bars are maximal and minimal values; horizontal line shows median. *p<0.05, **p<0.005, ***p<0.001 KO T0 vs WT ; §p<0.05, §§p<0.05, §§§p<0.001 Dula vs KO T0, by two-way or one-way ANOVA (as suitable) followed by Sidak’s or Dunn’s correction for multiple comparisons. Dula, dulaglutide; T0, time zero (treatment initiation)

