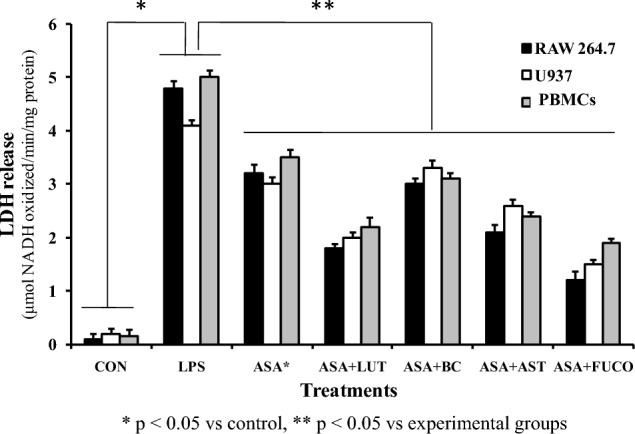
Fig. 4.

Effect of combined treatment of carotenoids with ASA on LPS induced LDH to release in macrophages and PBMCs incubated for 12 h. The data represent mean ± SD (n = 5). a,b,c,d,e,fValues not sharing common superscript letters between treatment groups are significantly different (p < 0.05) from their respective control as analyzed by one-way ANOVA followed by Tukey's test. Refer to Table 1 and Fig. 1 for abbreviations and doses for treatment groups
