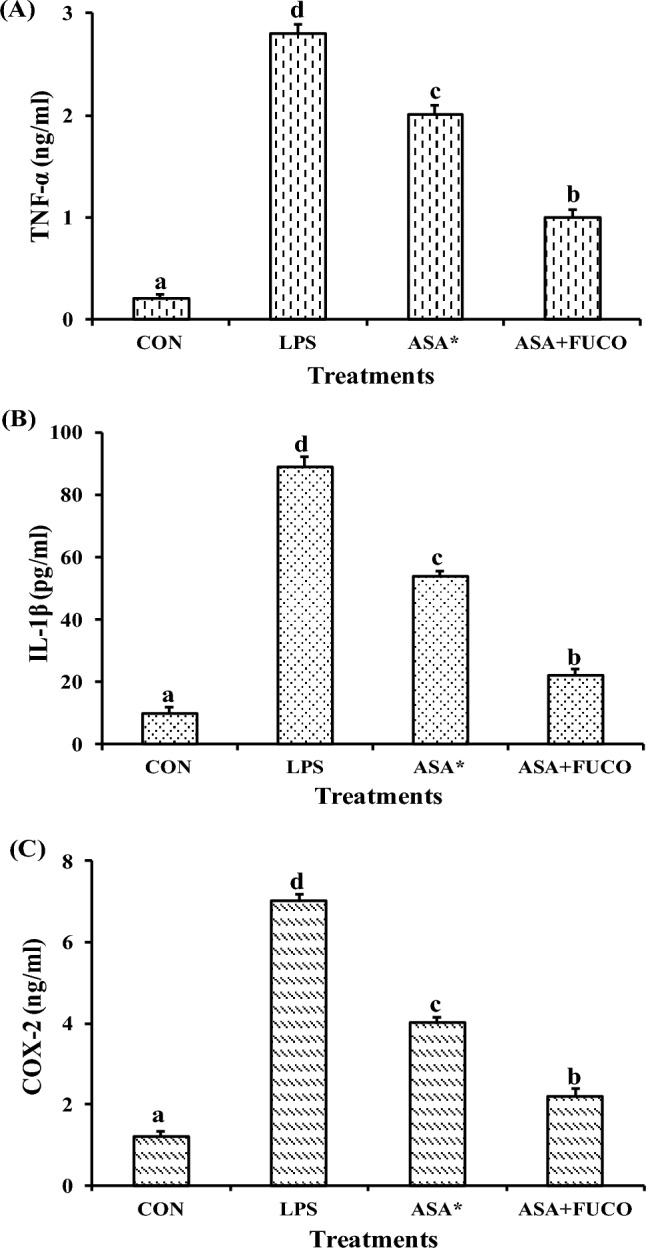
Fig. 7.

Influence of carotenoid plus ASA treatment on TNF-α (A), IL-1β (B) and COX-2 (C) protein concentration against pre-treated with LPS in RAW 264.7 cells. The data represent mean ± SD (n = 5). a,b,c,d Values not sharing a common superscript letters between treatments are significantly different (p < 0.05) as analyzed by one-way ANOVA followed by Tukey's test. Refer to Table 1 and Fig. 1 for abbreviations and treatment doses
