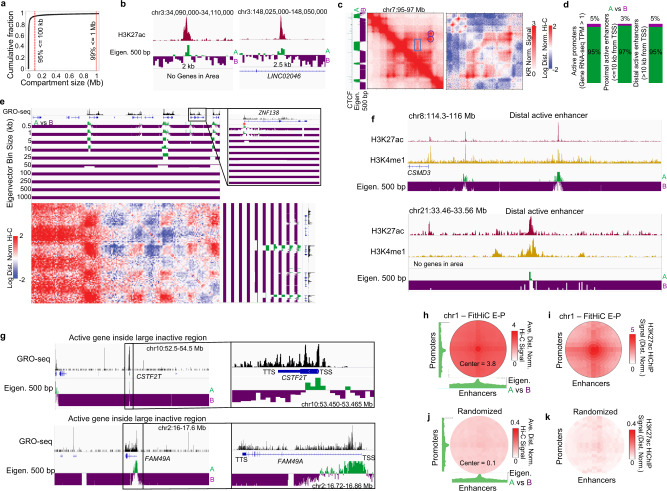
Fig. 2. Nearly all active TSSs and enhancers localize to kilobase-scale A compartments.
a Cumulative fraction of compartment domain sizes when identified at 500 bp resolution. b Examples of small compartment intervals. c Example of a compartmental interval smaller than an inside a CTCF loop. Observed and distance-normalized maps are shown to highlight the compartment interactions. Circles highlight loops that encompass the compartment interaction pattern indicated by a rectangle. CTCF ChIP-seq and eigenvector are shown on the side. d Percentage of active gene promoters, proximal enhancers, and distal enhancers assigned to A (green) or B (purple) compartment intervals when identified by the 500 bp compartment eigenvector. Source data are provided as a Source Data file. e Example of small compartment intervals only identifiable at high-resolution (red asterisks). Log transformed and distance normalized Hi-C map is shown alongside the eigenvector tracks at various bin sizes. f Examples of active enhancers denoted by H3K27ac and H3K4me1 signal localizing to the A compartment and surrounded by the B compartment. g Examples of active promoters denoted by GRO-seq signal localizing to the A compartment and surrounded by B compartment intervals. h Average eigenvector (green tracks) and Hi-C signal at promoters and enhancers identified by FitHiC. i Average H3K27ac HiChIP signal at those same loci. j Average Hi-C and k H3K27ac HiChIP signal at the same promoters and enhancers, but they are randomly assigned to each other. Color intensity scales on (j) and (k) are 10-fold lower to highlight the lack of signal even at this lower range.

