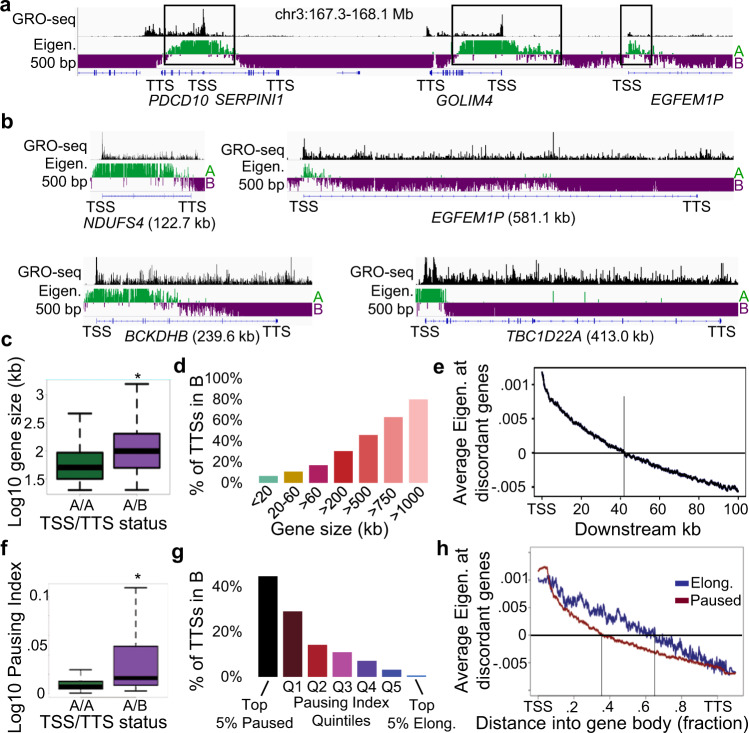
Fig. 3. Many genes exhibit discordant compartmentalization.
a, b Examples of genes of various sizes where the TSS is in the A compartment while the TTS is in the B compartment. GRO-seq signal is shown as an indicator of the gene’s transcription status. Black rectangles indicate regions of TSSs that reside in the A compartment. c Sizes of genes with concordant (labeled A/A & green) or discordant (labeled A/B & purple) compartments. * indicates p < 2.2e-16 two-sided Wilcoxon Rank Sum, n = 6021 (AA) and 510 (AB). Source data are provided as a Source Data file. d Percentage of TTSs that localize to the B compartment for genes of various sizes that have the TSS in the A compartment. Source data are provided as a Source Data file. e Average profile of the eigenvector at discordant genes. The vertical line indicates the distance where the average eigenvector value equals zero. f Pausing Index of genes with concordant (labeled A/A & green) or discordant (labeled A/B & purple) compartments. * indicates p < 2.2e-16 two-sided Wilcoxon Rank Sum, n = 6021 (AA) and 510 (AB). Source data are provided as a Source Data file. g Percentage of TTS that localize to the B compartment for genes with different pausing statuses and have the TSS in A. Source data are provided as a Source Data file. h Scaled average profiles of the compartment eigenvector for elongating (blue) or paused (red) discordant genes. The vertical line indicates the distance where the average eigenvector value equals zero.

