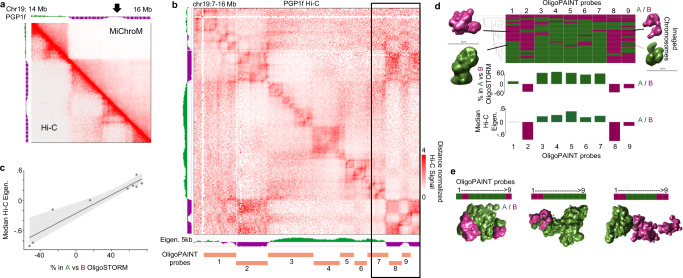
Fig. 5. Ambiguous Hi-C compartment intervals have high heterogeneity.
a Hi-C map compared to MiChroM in PGP1f cells. Arrow indicates a locus with ambiguous eigenvector values, which MiChroM had difficulty predicting. b Distance normalized Hi-C map of PGP1f cells, with the imaged segments denoted. Rectangle highlights the section modeled by MiChroM. c Median eigenvector within each imaged segment (y-axis) compared to the relative percent of images where that location was in A vs. B by OligoSTORM (x-axis). The line represents a linear fit, R2 = 0.91, while the shaded area is a fit encompassing all data points. d The imaging-based compartment status in single chromosomes. Heatmap represents the A or B designation of each imaged segment (columns) based on spatial and volumetric features of individual chromosomes in single cells (rows). On the sides are representative images of the corresponding genomic segments. Below are the percentage of individual chromosomes where the imaging reflects A vs. B compartment segments compared to the median eigenvector. Source data are provided as a Source Data file. e Representative images of the entire region colored by the A/B designation of each imaged segment. MichroM model parameters are included in Source Data.

