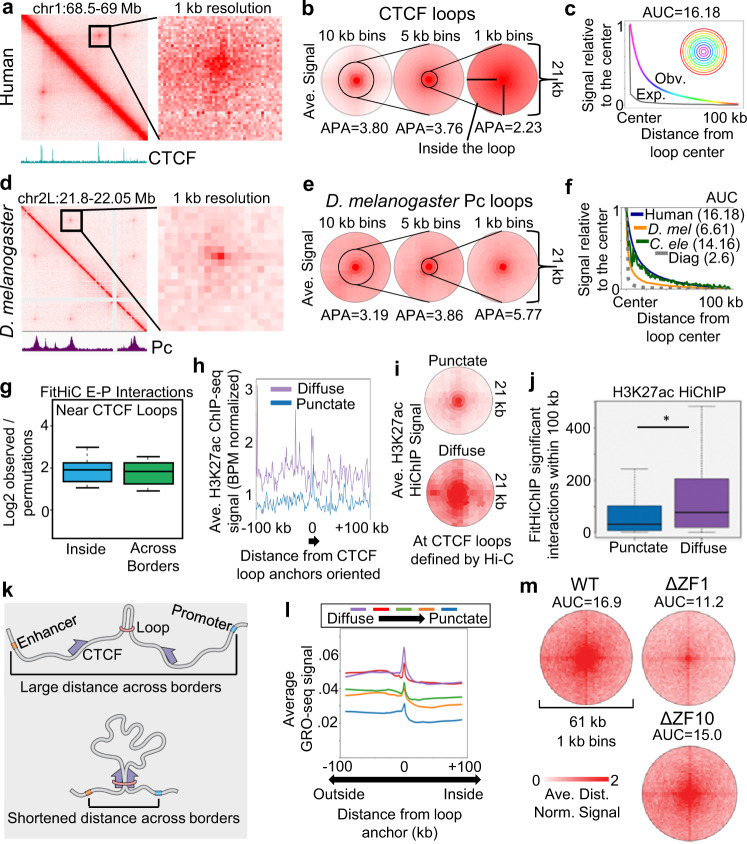
Fig. 6. Diffuse CTCF loops are dependent on RNA-binding domains.
a Example of broad signal enrichment near CTCF loops when binned at 1 kb. The CTCF ChIP-seq signal is shown below. b Average signal at CTCF loops when binned at 10, 5, or 1 kb, centered on convergent CTCF anchors. c Average Hi-C signal in 1 kb bins at each radial distance away from the CTCF loop anchors (rainbow). The average signal of the diagonal decay is shown for reference (gray) to estimate interactions due to polymeric distance. AUC = area under the curve. d Example of punctate signal enrichment at Pc loops in D. melanogaster when binned at 1 kb. The Pc ChIP-seq signal is shown below. e Average signal at D. melanogaster Pc loops when binned at 10, 5, or 1 kb. f Average Hi-C signal in 1 kb bins at each radial distance away from human CTCF loop anchors (blue) vs. D. melanogaster Pc loops (orange) and C. elegans X-chromosome loops (green). The average signal at the C. elegans Hi-C diagonal is shown for reference (gray). AUC = area under the curve. g Enrichment vs. random regions of Fit-Hi-C enhancer-promoter interactions within 100 kb of loops inside the loop (blue) or crossing over loop boundaries (green). Boxplots represent the median and the interquartile range (IQR), with whiskers representing 1.5*IQR. n = 18,948 EP FitHiC interactions, 2559 CTCF loops, and 10 permutations. Average H3K27ac ChIP-seq (h) and HiChIP (i) signal near diffuse vs. punctate CTCF loop anchors. j Number of H3K27ac HiChIP significant interactions determined by FitHiChIP near punctate (n = 1076) vs. diffuse (n = 1086) CTCF loop anchors. Boxplots represent the median and the interquartile range (IQR), with whiskers representing 1.5*IQR. * indicated p < 2.2e-16 Wilcoxon sum-rank test. k Diagram of how CTCF loops can shorten distances between enhancers (orange) and promoters (blue) even when both are located outside of the loop. l Average GRO-seq signal at CTCF loop anchors and neighboring loci for loops divided into five distinct diffuse categories. m Average Hi-C signal in WT (left), ΔZF1 (right), or ΔZF10 (bottom) CTCF mutants at CTCF loops. AUC area under the curve.

