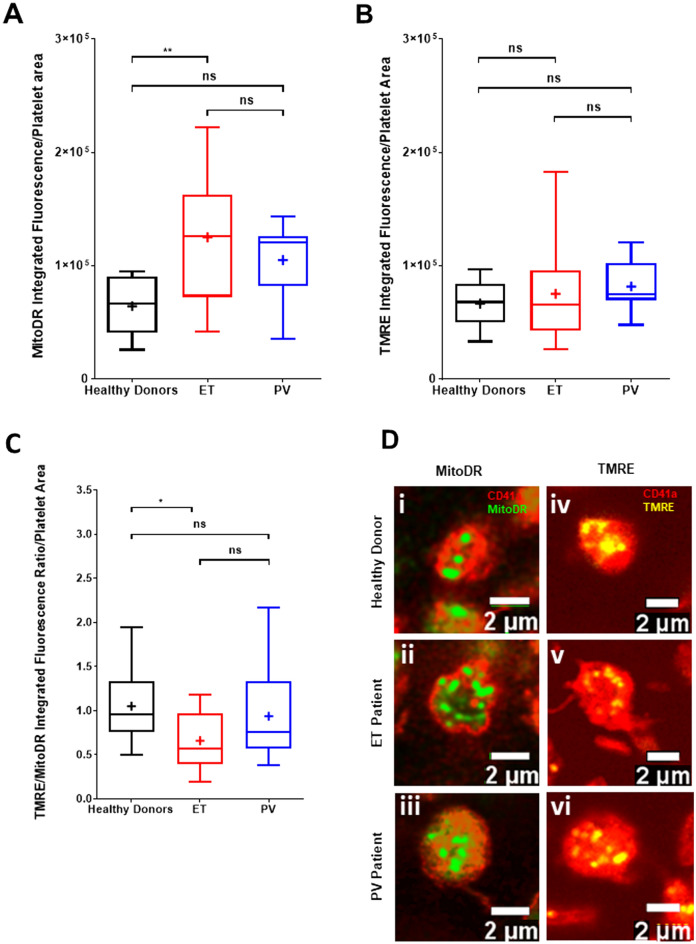
Figure 3.
Confocal microscopy shows an increased proportion of dysfunctional mitochondria in resting platelets of ET patients. (A) Comparison of MitoDR staining of platelet mitochondria in healthy donors (n = 9), ET (n = 12) and PV (n = 8) patients as an indicator of mitochondrial mass within platelets. (B) Comparison of TMRE staining of platelet mitochondria as an indicator of functional mitochondria within platelets. (C) Comparison of TMRE/MitoDR ratios between healthy donors, ET and PV patients as an indicator of the number of functional mitochondria in proportion to overall mitochondrial mass within platelets. Bar-whisker plots, showing minimum to maximum values, median, interquartile range and mean (+), represent the spread of individual subject means per group. Data were analysed using a one-way ANOVA and Tukey’s multiple comparisons test. P < 0.05 (*), P < 0.01 (**) = significant, ns = not significant. (D) Representative confocal images showing the total number of mitochondria (i–iii) and the number of functional mitochondria (iv–vi) within platelets from healthy donors, ET and PV patients, respectively, as indicated by CD41a (red), MitoDR (green) and TMRE (yellow) staining.

