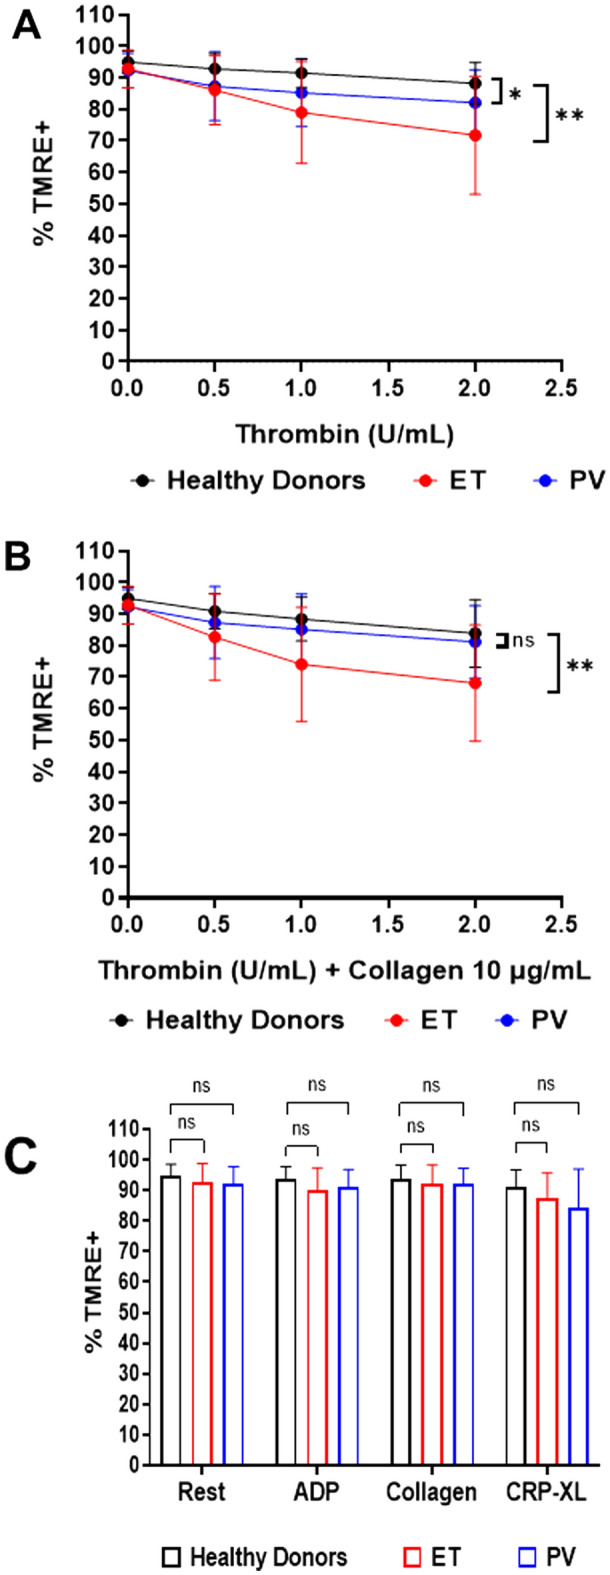
Figure 4.

MPN platelet mitochondria are hypersensitive to depolarization following stimulation with thrombin. (A, B) Dose–response curves derived from stimulation with various concentrations of thrombin (A) or thrombin with collagen (10 µg/mL) (B) in healthy donors (n = 20) or ET (n = 35) and PV (n = 9) patients. Error bars for each point represent differences between individuals. Data analysis was by a mixed-effects 2-way ANOVA followed by Tukey’s multiple comparisons test. P < 0.05 (*), P < 0.01 (**) = significant, ns = not significant. (C) TMRE staining of mitochondria of healthy donors (n = 19–20), ET (n = 31–36) and PV (n = 9–11) patients under resting conditions, and following stimulation with ADP (5 mg/mL), collagen (10 µg/mL), or CRP-XL (1 µg/mL) alone. Column graphs showing error bars represent differences between individual subjects. Data were analysed using a one-way ANOVA or Kruskal–Wallis test. P < 0.05 (*) = significant, ns = not significant.
