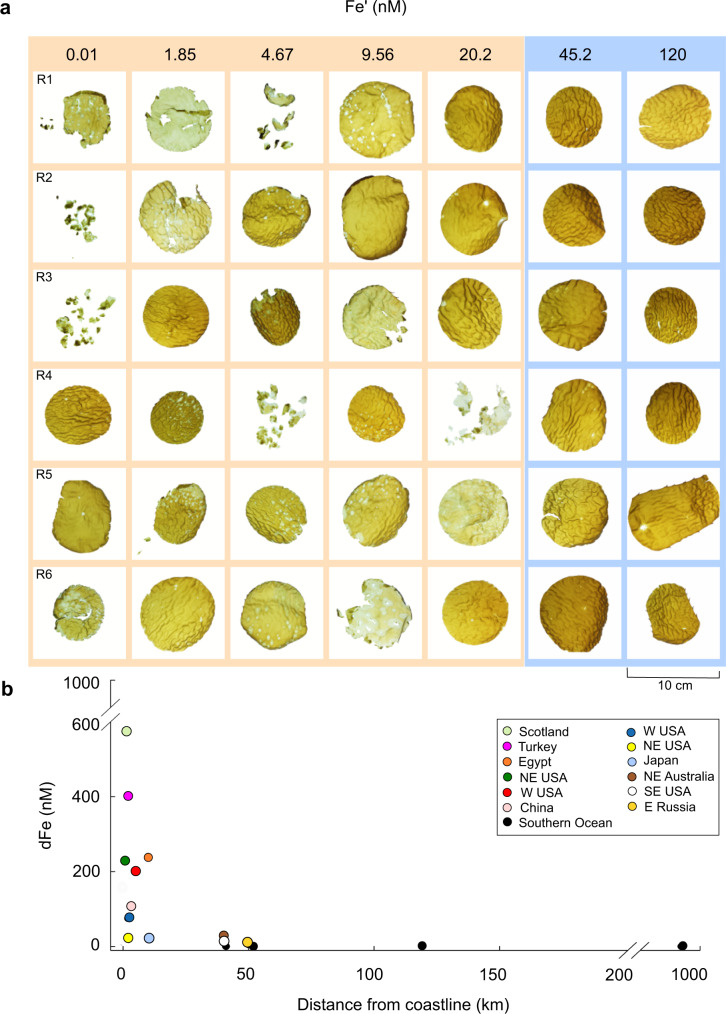
Fig. 1. Condition of M. pyrifera replicates as a result of Fe′ concentrations and natural concentrations of dFe along a coastal to open-ocean gradient.
a Photographs of individual discs of M. pyrifera replicates (n = 6, labelled R1-R6) at the end of a 14-day Fe′ experiment (0.01–120 nM). Coloured panels are used to represent the disparity between healthy replicates at 45.2–120 nM Fe′ (blue panel) and those displaying symptoms of physiological stress and mortality ≤ 20.2 nM Fe′ (orange panel). Inorganic Fe (Fe′) values in the upper panel correspond to total dFe concentrations of 0, 1, 2.5, 5, 10, 20 and 40 μM for each treatment ( + 7.25 nM background dFe in nutrient-spiked seawater). b Plot of dFe concentrations (nM) against distance offshore (km). Black circles denote dFe concentrations collected on GEOTRACES-SR3 Southern Ocean voyage35 as an example of the dFe concentrations observed uniformly in the open ocean (0.1–0.6 nM)8,36 and coloured circles depict dFe concentrations collated from a comprehensive literature search on coastal sites (see Supplementary Data 1). For comparison, the dFe concentration of 1000 nM equates to 1.85 nM Fe′.

