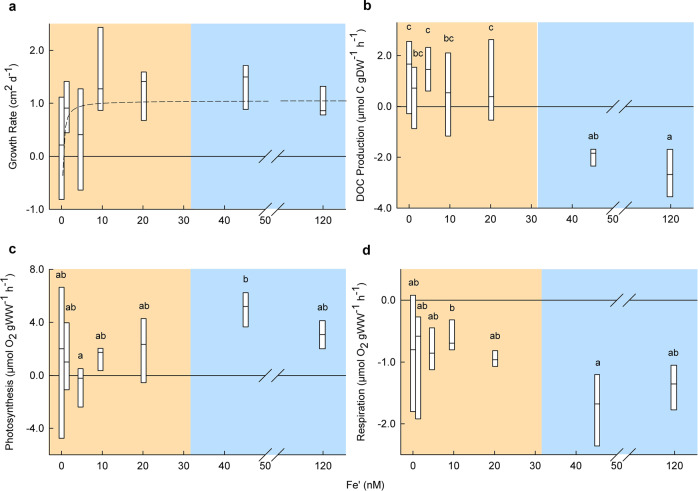
Fig. 2. Fe′ concentrations drive rates of growth, photosynthesis, respiration and DOC production for M. pyrifera.
a–d Influence of Fe′ concentration on M. pyrifera showing, a growth, with a modelled rectangular hyperbola (adjusted R2 = 0.122), b DOC production was observed at ≤ 20.2 nM Fe′ but not observed for 45.2–120 nM Fe′ (one-way ANOVA, P < 0.01, F value = 8.473, df = 6). The negative DOC flux at 45.2–120 nM Fe′ likely represents consumption by the seaweed biome72. c Increased net photosynthetic rates and d respiration rates at ≥ 45.2 nM compared to ≤ 9.56 nM Fe′ (one-way ANOVAs, photosynthesis P = 0.057, F value = 2.285, df = 6 and respiration P = 0.047, F value = 2.406, df = 6). Boxes show minimum, 1st quartile, median, 3rd quartile and maximum data values (n = 6). Note no box whiskers, as the lower quartile is equal to the minimum value, and the upper quartile is equal to the maximum value. For significant results, Fe′ concentrations displaying the same letter were not significantly different in post hoc tests. The disparity between healthy replicates observed in Fig. 1a (45.2–120 nM Fe′) and those with symptoms of physiological stress (≤ 20.2 nM Fe′) is indicated by blue and orange panels, respectively. For full statistical results and post hoc tests see Supplementary Data 2 and 3.

