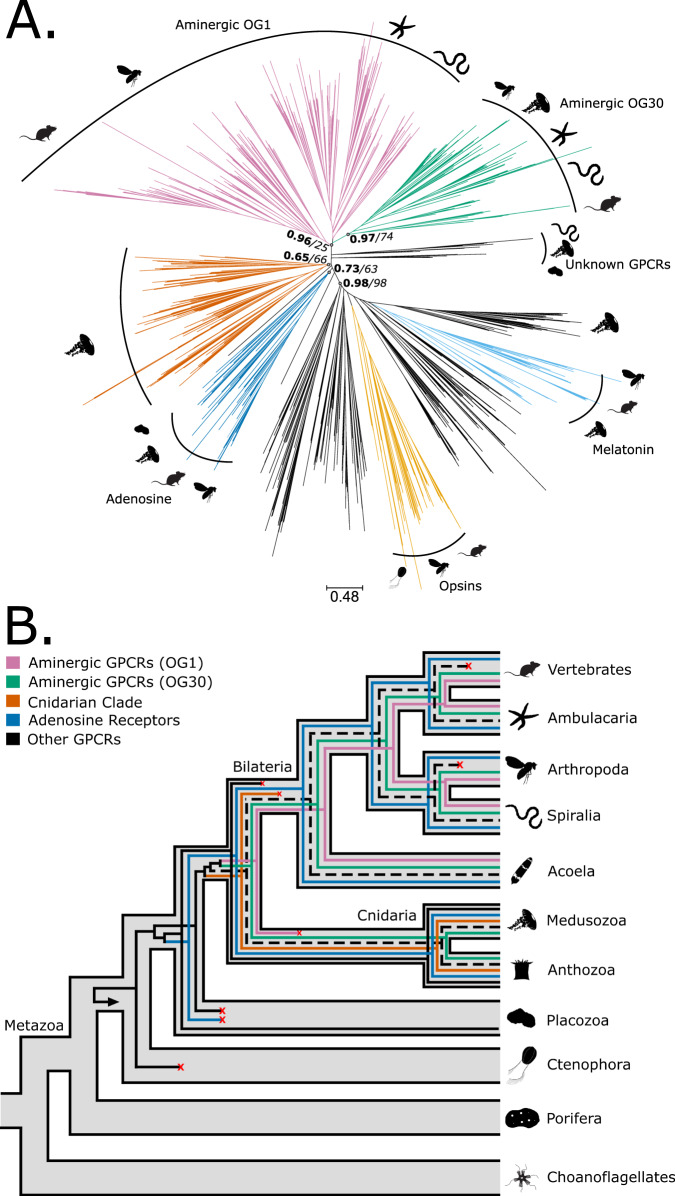
Fig. 5. Phylogeny and reconciliation of the monoaminergic GPCRs.
A Transfer bootstrap expectation tree and (B) simplified illustration of reconciliation calculated using Generax for monoaminergic g-protein coupled receptors (GPCRs). The nodal supports shown are transfer bootstrap expectation (TBE) scores (in bold), and ultrafast bootstrap proportion supports (in italic) for key nodes. Dashed lines indicate sequences identified as unstable in the t-index and leaf stability index (LSI) analysis (see Supplementary Data 6 for details). OG orthogroup. Silhouettes obtained from Phylopic.org. Silhouette images are by Andrew R. Gehrke (Hofstenia miamia); Daniel Jaron (Mus musculus); Mali’o Kodis, photograph by Ching (http://www.flickr.com/photos/36302473@N03/) (Chrysaora fuscescens); Mario Quevedo (Asteriidae); Oliver Voigt (Trichoplax adhaerens); Ramiro Morales-Hojas (Drosophila americana); Steven Haddock, Jellywatch.org (Hormiphora californensis); and Tess Linden (Salpingoeca rosetta). Source Data are available at [https://figshare.le.ac.uk/articles/dataset/Monoamine_Neuromodulation_is_a_Bilaterian_Innovation_Results/20391477] in Results/GPCRAnalysis/GeneTrees labelled GPCR_CLANs_TBE.tbe.tree and GPCR_CLANs_UFB.treefile.

