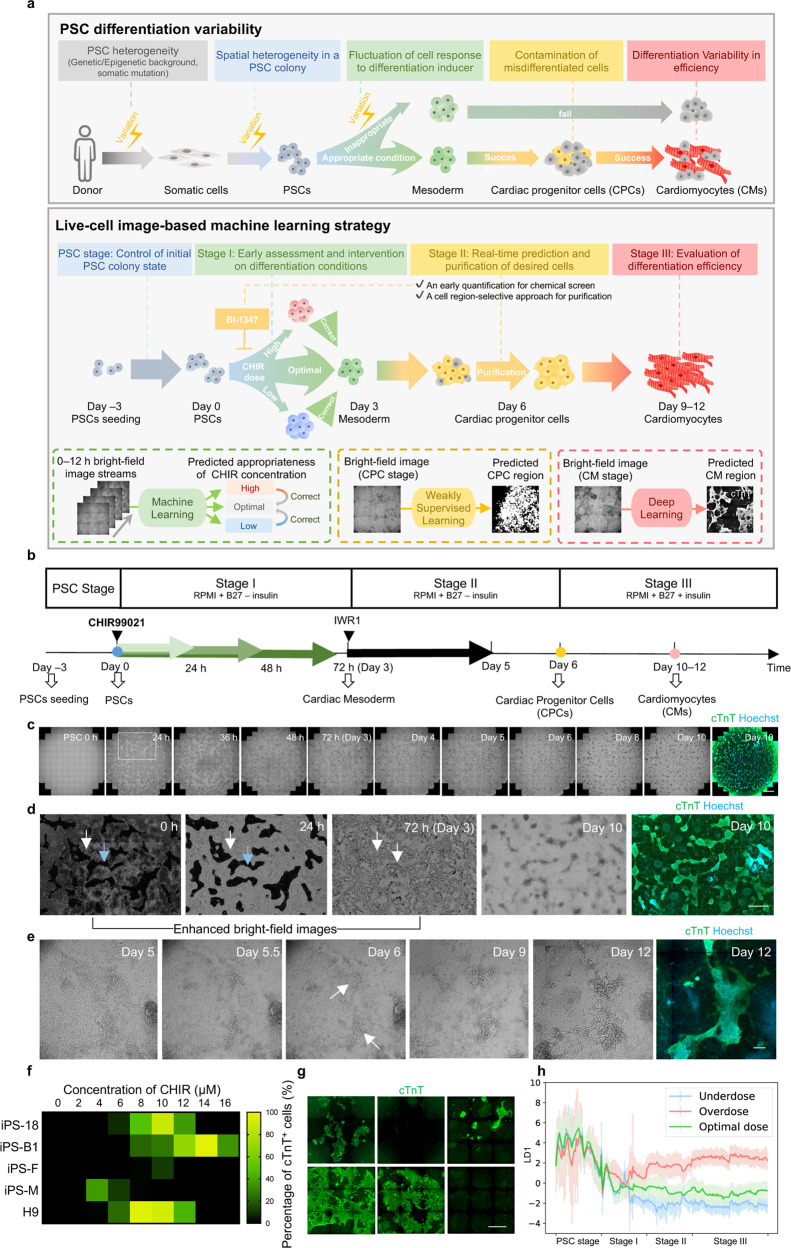
Fig. 1. Framework for image analysis on the PSC-to-CM differentiation process.
a Schematic overview of the PSC differentiation strategy based on image-based ML for solving the variability in efficiency, using CM differentiation as an example. Upper panel, variation occurs at each step in the PSC differentiation process. Lower panel, based on the bright-field image-based ML, our strategy is applicable at different stages to reduce the variation, achieving high-efficiency CM induction. b Schematic overview of PSC-to-CM differentiation with small-molecule modulators of canonical Wnt signaling. The green arrows (indicating the titration of CHIR durations and concentrations at stage I) and the colored dots represent the checkpoints involving ML in our strategy. c Example time-lapse bright-field images and cTnT fluorescence result of cardiac differentiation for 10 days. Cells were cultured in a 24-well plate. The enlargement of the image in the white frame is shown in d. Scale bar, 1 mm. d Location and morphology of successfully and unsuccessfully differentiated cells in the whole differentiation process. 0 h, 24 h, and 72 h bright-field images were enhanced and shown in inverted color for highlighting the edge of the cell colony (white arrows and blue arrows indicate the cell-containing area and cell-free area, respectively). Scale bar, 1 mm. e Texture and morphological change of successfully differentiated cells from day 5 to day 12. The white arrow indicates the day 6 CPC with texture. Scale bar, 250 μm. f Line-to-line variability of cardiac differentiation efficiency. CHIR duration = 24 h. g Batch-to-batch variability of cardiac differentiation efficiency. iPS18-derived CM differentiation followed the same differentiation protocol but from different batches for 12 days (CHIR concentration = 6 μM, duration = 24 h). Scale bar, 1 mm. h Change of image local features under different CHIR doses in cardiac differentiation. The y-axis is the first linear discriminant (LD1) given by LDA. The dark lines and the light lines represent the mean and the standard deviation value, respectively.

