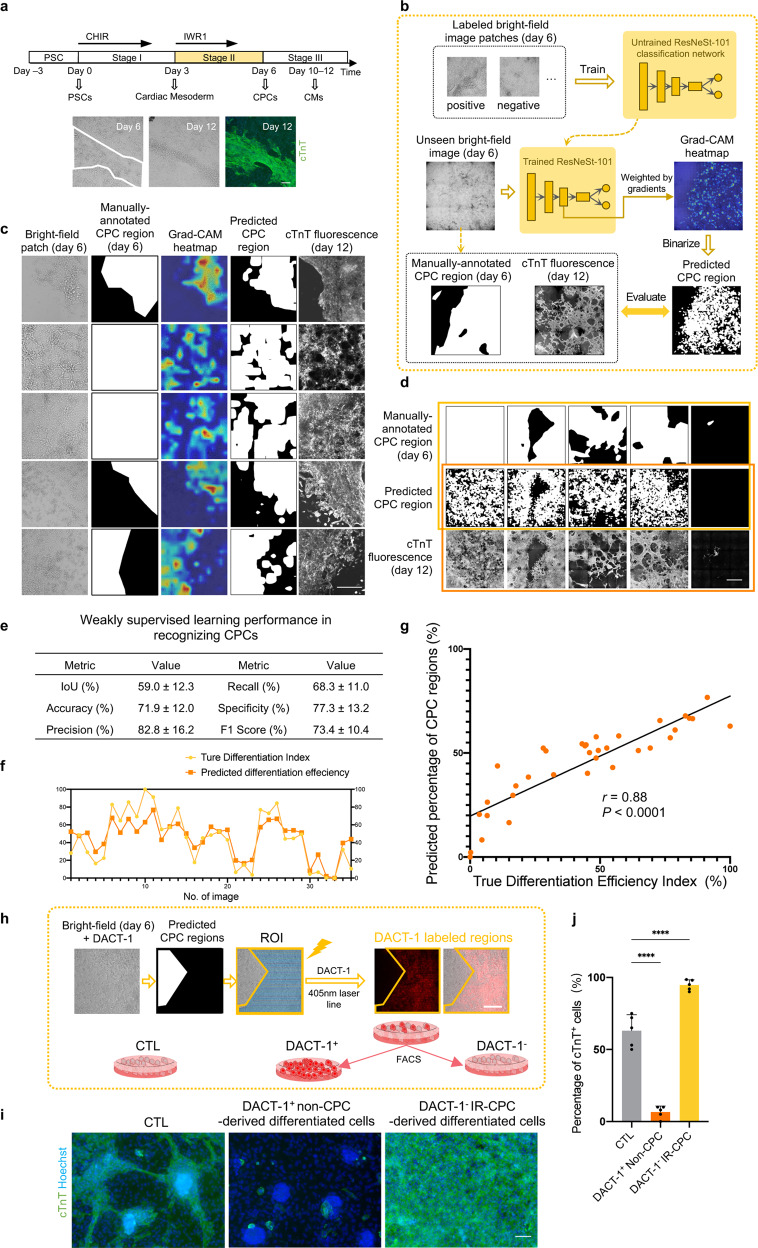
Fig. 3. CM-committed CPC recognition and purification by weakly supervised learning on bright-field images.
a Morphological characteristics of CPCs (circled by white lines) and non-CPCs on day 6. Representative day 6 bright-field image, day 12 bright-field image, and cTnT fluorescence results were shown. Scale bar, 200 μm. b Schematic of the weakly supervised learning model for CPC recognition from day 6 live-cell bright-field images. The ResNeSt network was trained with bright-field patches labeled with “positive” or “negative”. For a new bright-field image, the trained ResNeSt combined with Grad-CAM could generate a heatmap highlighting the regions important to the ResNeSt’s inference. The prediction of CPC regions was obtained by binarizing the heatmap. For evaluation, the predicted CPC regions were compared with manually annotated CPC regions (segmentation masks) on day 6 and the final cTnT fluorescence image at the CM stage. c Typical predicted results of CPC recognition on positive bright-field patches from the test set. Each column from left to right represents: live-cell bright-field image patches on day 6; manually annotated CPC regions; Grad-CAM heatmap for CPC localization; binary prediction of CPC regions; true cTnT fluorescence result of day 12. Scale bar, 250 μm. d Typical predicted results of CPC recognition on whole-well bright-field images from the test set. Each row from top to bottom represents: manually annotated CPC regions; binary prediction of CPC regions; true cTnT fluorescence result of day 12. Statistical analysis was performed on the first two rows (in the yellow frame) shown in e and the last two rows (in the red frame) shown in f, g. Scale bar, 1 mm. e Performance of CPC recognition, evaluated by comparing manually annotated CPC regions and binary prediction of CPC regions. Data are means ± SD. n = 35 wells. f Comparison of the true Differentiation Efficiency Index (from day 12 cTnT fluorescence results) and the predicted percentage of CPC region (from day 6 bright-field images). The true Differentiation Efficiency Index was normalized between 0 and 100%. n = 35 wells. g Correlation between the true Differentiation Efficiency Index (from day 12 cTnT fluorescence results) and the predicted percentage of CPC regions (from day 6 bright-field images), with Pearson’s r value. The true Differentiation Efficiency Index was normalized between 0 and 100%. n = 35 wells. h Experimental setup of DACT-1-based CPC purification. Cells were preincubated by DACT-1 on day 6; cells were selectively photoactivated (405 nm laser) using ROI scanning mode of a microscope guided by the predicted result; then the fluorescence-labeled cells (λmax = 560 nm) and unlabeled cells were digested into single cells and separated by FACS to achieve purification. Scale bar, 100 μm. i Purification effect of day 6 IR-CPCs. After FACS, DACT-1-labeled non-CPCs, unlabeled IR-CPCs, and cells of the control (CTL) group were subsequently cultured for 6 days in RPMI + B27 medium. The purity of subsequently differentiated CMs was identified by immunostaining of cTnT. All the cells were from the same batch and under the same differentiation condition. Scale bar, 100 μm. j Quantitative analysis of the percentage of cTnT+ cells in i. Data are means ± SD. n = 5 images. *P < 0.05; ****P < 0.0001 by one-way ANOVA followed by Dunnett’s multiple comparisons tests.

