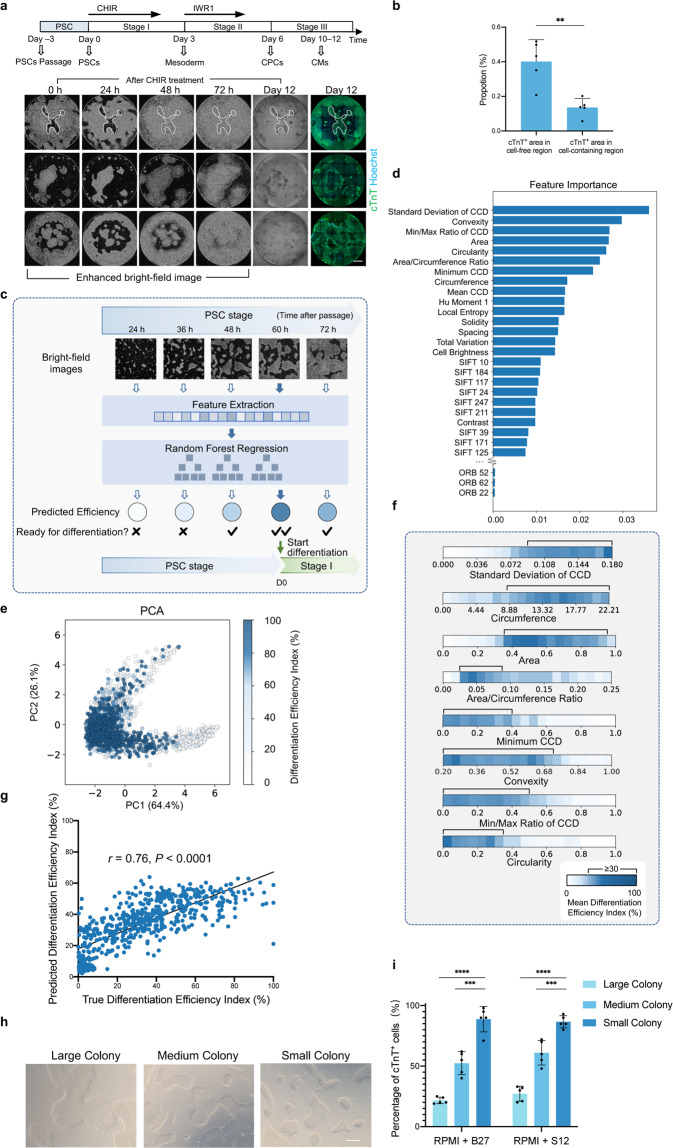
Fig. 5. Controlling the initial state of PSC colonies hinted by time-lapse images.
a Different differentiation tendencies between cells located at the periphery and center (spatial heterogeneity) of the PSC colony indicated by the image streams. The 0–72 h bright-field images were enhanced and shown in inverted color for a clearer colony edge. After CHIR treatment, PSC colonies start to contrast at 0 h; starting from ~24–48 h, cells located at the periphery of the colony migrate into the cell-free region (circled in time-lapse images of the first row as an example) until the whole well was filled at ~72 h. This group of migrating cells is likely to successfully differentiate, while the cells located at the center of a large colony tend to fail. Scale bar, 1 mm. b Comparisons between the proportion of the cTnT+ area (day 12) in cell-free regions and in cell-containing regions (0 h). Data are means ± SD. n = 5 wells. Statistical significance was determined by paired t-test, **P < 0.01. c Schematic diagram of the ML-based control of initial PSC colony states. During the PSC stage, image features of PSC colonies were extracted and passed to a random forest regression model for efficiency prediction in real-time, providing guidance for identifying the most conducive starting point for differentiation. d Importance weights of the 343 features determined by the random forest model. The feature importance weights were computed on the training set (n = 1350 wells). CCD, Centroid-Contour Distance. e PCA plot of the eight features with the most importance weights in d. The color represented the Differentiation Efficiency Index, which was normalized between 0 and 100%. n = 1934 wells. f The relationships between the mean differentiation efficiency and the eight features with the most importance weights shown in d. The range of each feature was divided into 20 bins, and the mean Differentiation Efficiency Index in each bin was computed. n = 1934 wells. g Correlation between the true and the predicted Differentiation Efficiency Index, with Pearson’s r value. n = 584 wells. h Bright-field images (0 h, before CHIR treatment) of PSC colonies with different sizes, controlled by digestion time and operation during passaging. The number of initial PSCs was strictly identical among wells. Scale bar, 50 μm. i Effect of different PSC colony sizes on differentiation efficiency using RPMI + B27 protocol and RPMI + S12 protocol. Data are means ± SD. n = 5. Statistical significance was determined by t-test, ***P < 0.001; ****P < 0.0001.

