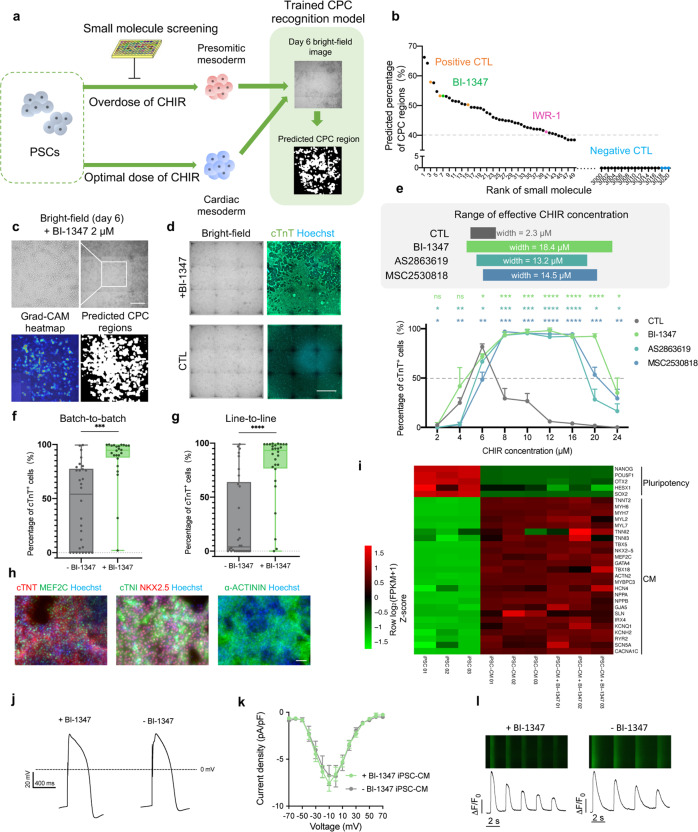
Fig. 6. Small molecule screening for broadening the range of effective CHIR concentration based on the CPC recognition model.
a Schematic overview of the small molecule screening. A ~3000-compound library was screened for counteracting the differentiation tendency to presomitic mesoderm under a high CHIR dose (16 μM, 0–48 h). The differentiation efficiencies were estimated by using the CPC recognition model on day 6 bright-field images. b Preliminary small molecule screening result ordered by the predicted percentage of CPC regions on day 6. Cells of positive CTL were treated with optimal CHIR, while cells of negative CTL (DMSO) or library screening groups were treated with overdose CHIR (16 μM, 48 h). c Effect of BI-1347 (2 μM, 48 h) during preliminary screening. The heatmap and the predicted CPC regions are generated by the CPC recognition model. Scale bar, 500 μm. d Effect of BI-1347 on improving differentiation efficiency under high CHIR dose (20 μM, 48 h). Representative bright-field images and fluorescence images of cTnT on day 12 were shown. Scale bar, 1 mm. e Effect of CDK8 inhibitors (0.5 μM, 48 h) on improving the differentiation efficiency under titration of CHIR concentrations using iPS-B1 line. CHIR was added with BI-1347, AS2863619, or MSC2530818 for 0–48 h. The widths of effective CHIR concentration (percentage of cTnT+ cells ≥ 50%, indicates by a dashed line) were shown in the upper panel. Data are means ± SD. n = 3. Statistical significance was determined by t-test to compare the BI-1347, AS2863619, and MSC2530818 groups with the CTL group under each CHIR concentration. *P < 0.05, **P < 0.01, ***P < 0.001, ****P < 0.0001; ns, not significant. f Effect of BI-1347 on improving the consistency of batch-to-batch differentiation efficiencies. Cells from different batches were treated with CHIR (6 μM, 48 h) or CHIR (12 μM, 48 h) plus BI-1347 (0.5 μM, 48 h) on the iPS-B1 line. ***P < 0.001. g Effect of BI-1347 on improving the consistency of line-to-line differentiation efficiencies. Cells from six different lines (iPS-B1, iPS-18, iPS-F, iPS-M, H9, WIBR3) were treated with CHIR (6 μM, 48 h) or CHIR (12 μM, 48 h) and BI-1347 (0.5 μM, 48 h). ****P < 0.0001. h Immunofluorescent result of CM with BI-1347 treatment (0.5 μM, 48 h) under high CHIR dose (16 μM, 48 h). Representative fluorescent images of CM with BI-1347 treatment for cTnT, MEF2C, cTNI, NKX2.5, and α-ACTININ on day 12 were shown. Scale bar, 100 μm. i Gene expression data for iPSC, iPSC-CM without BI-1347 treatment, and with BI-1347 (0.5 μM, 48 h)- treated iPSC-CM (day 12, both without metabolic purification). Heatmap shows Z-scores of log2(FPKM + 1) normalized over multiple samples. j Action potential in iPSC-CMs with (+BI-1347, 0.5 μmol/L, 0–48 h) or without (–BI-1347) BI-1347. k I–V plots of ICa in iPSC-CMs with or without BI-1347. Data are expressed as means ± SEM. n = 15–16. l Fluorescent images (upper) and time courses (lower) of spontaneous calcium transients in iPSC-CMs with or without BI-1347.

