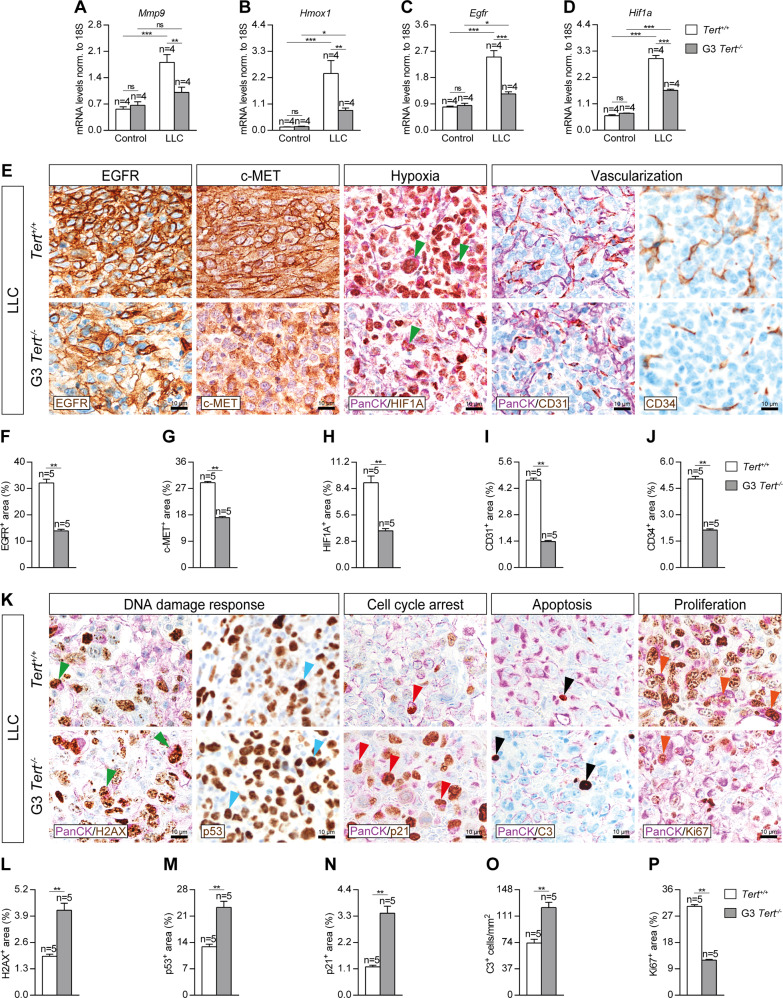
Fig. 2. Telomerase deficiency in the tumor microenvironment reduces lung tumor progression, invasion and vascularization reducing cell proliferation and increasing DNA damage response, cell cycle arrest and apoptosis.
Lung tissue mRNA expression levels of Mmp9 (A), Hmox1 (B), Egfr (C) (tumor progression markers) and Hif1a (hypoxia and tumor invasion) (D) normalized to 18S expression in Tert+/+ and G3 Tert−/− mice. Representative lung immunostainings for EGFR (brown), c-MET (brown), PanCK (Pan-Cytokeratin) (purple) and HIF1A (brown; green arrowheads indicate double PanCK+-HIF1A+ tumor cells), PanCK (purple) and CD31 (brown), and CD34 (brown) (E), and quantification of EGFR and c-MET (tumor progression) (F, G), HIF1A (hypoxia and tumor invasion) (H), CD31 (undifferentiated blood vessels) (I) and CD34 (differentiated blood vessels) (J) positive areas in LLC-challenged Tert+/+ and G3 Tert−/− mice. K Representative lung immunostainings for PanCK (purple) and γH2AX (brown; green arrowheads indicate double PanCK+-γH2AX+ tumor cells), p53 (brown, blue arrowheads indicate p53+ cells), PanCK (purple) and p21 (brown; red arrowheads indicate double PanCK+-p21+ tumor cells), PanCK (purple) and Cleaved Caspase-3 (C3, brown; black arrowheads indicate C3+ cells), and PanCK (purple) and Ki67 (brown; orange arrowheads indicate double PanCK+-Ki67+ tumor cells) in lung sections from LLC-challenged Tert+/+ and G3 Tert−/− mice. Quantification of γH2AX and p53 (DNA damage response) (L–M), and p21 (cell cycle arrest) (N) positive areas, number of C3 (apoptosis) positive cells/mm2 (O) and Ki67 (proliferation) positive area (P) in LLC-challenged Tert+/+ and G3 Tert−/− mice. Data are expressed as mean ± SEM (the number of mice is indicated in each case). *p < 0.05; **p < 0.01; ***p < 0.001 (Dunn–Sidak test for multiple comparisons and Mann–Whitney or unpaired t tests to compare 2 independent groups).

