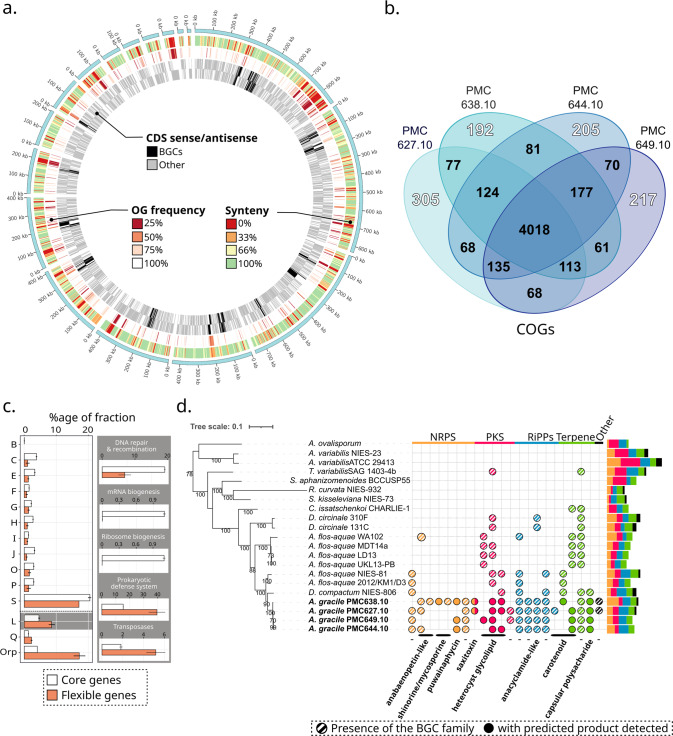
Fig. 1. Comparative genomics between the four A. gracile strains.
a Representation of the PMC627.10 A. gracile genome displaying from the inner to the outer circle: (i) the coding DNA sequence (CDS) on both strands with biosynthetic gene clusters (BGCs) in black, (ii) frequency (%) of CDS-associated clusters of orthologous genes (COGs) in the four A. gracile genomes, (iii) the synteny index, and (iv) the largest (>10kb) assembled scaffolds representing >99% of the genome. b Venn diagram of the distribution of COGs and singletons with white labels. c Percentage of COG functional categories with significant differences (Student’s t test with p < 0.01) between core (white) and flexible (red) gene sets, including a focus on the “Replication, Recombination and Repair” COG category (L). COG categories: B-“Chromatin structure/dynamics", C-“Energy production/conversion", E-“Amino acid metabolism/transport", F-“Nucleotide metabolism/transport", G-“Carbohydrate metabolism/transport", H-“Coenzyme metabolism", I-“Lipid metabolism", J-“Translation", O-“Post-translational modification/protein turnover/chaperone functions", P-“Inorganic ion transport/metabolism", Q-“Secondary metabolism", and S-“Function unknown". d Presence or absence of BGCs (COG category Q) among A. gracile strains and closed Nostocales taxa gathered by BGC types (‘-‘, uncharacterized product). The solid circles indicate BGCs whose products have been formally identified by mass spectrometry. Left: Phylogenomic tree (see Supplementary Methods and Table S1 for the list of genes used). Right: histogram displaying the number of BGCs by strain colored by BGC type. NRPS/PKS non-ribosomal peptide synthetase/polyketide synthetase, RiPPs ribosomally synthesized, post-translationally modified peptides, terpenes and others (uncharacterized). The lists of BGC and analytes detected in each strain can be found in Supplementary Tables S2 and S3, respectively.

