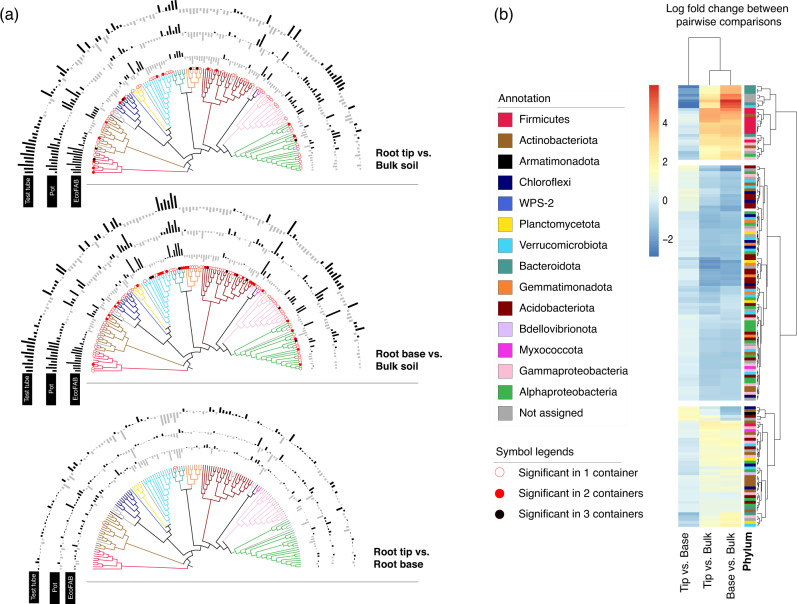
Fig. 2. Differentially abundant OTUs between different sample locations.
a Neighbor joining tree of selected OTUs which showed significant log fold changes during pairwise analysis of sample locations. The top tree depicts a pairwise comparison between root tip and bulk soil, middle tree between root base and bulk soil, and the bottom tree depicts the comparison between root tip and root base. The bar chart around the tree corresponds to log fold changes for each OTU in each of the different containers - test tube, pot or EcoFAB. An outward bar away from the tree represents a positive log fold change in the and an inward bar towards the tree represents a negative fold change in the respective OTU. The significant changes are indicated at the bottom of each node with a symbol. No symbol at the bottom of the node means the fold change is not statistically significant. b Clustering of selected OTUs based on pairwise comparison between sampling locations (ignoring containers) reveals three different clusters. Each OTU is colored by the phylum it belongs to.

