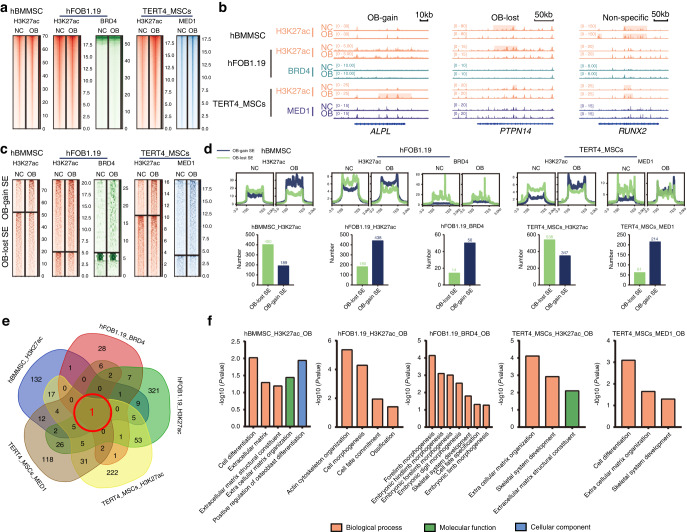
Fig. 1.
SE profile analysis and identification of critical OB-gain SEs. a ChIP-seq profile heatmaps showing H3K27ac abundance in hBMMSCs, H3K27ac and BRD4 abundance in hFOB1.19 cells and H3K27ac and MED1 abundance in immortal TERT4-MSCs. b Example signal traces of OB-gain, OB-lost and nonspecific SEs. The shadows indicate SE regions. c ChIP-seq profile heatmaps of the SEs identified by H3K27ac in hBMMSCs, H3K27ac and BRD4 in immortal hFOB1.19 and H3K27ac and MED1 in TERT4-MSCs cells. d The average SE signal levels are shown in line plots, and the numbers of OB-lost and OB-gain SEs are shown in histograms. e Venn diagram showing the intersecting OB-gain SEs from different datasets. f GO analyses of OB-gain SEs from different datasets

