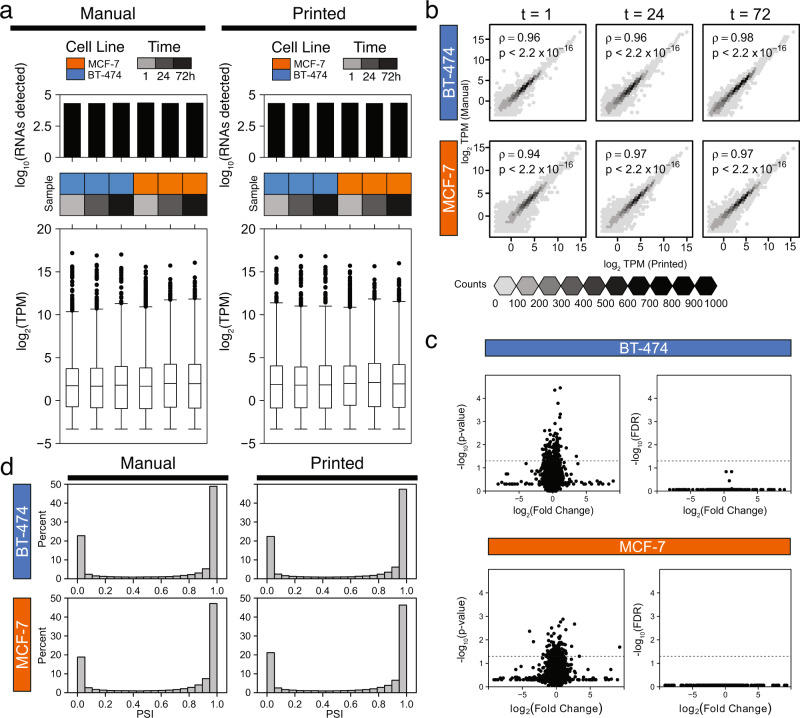
Fig. 2. Bioprinting does not significantly alter transcriptomes.
a Distributions of total number of RNAs detected (above) and RNA abundance (below) measured as transcripts per million (TPM) are similar between manually seeded (left) and bioprinted (right) cells. n = 30,544 transcripts were assessed across two independent experiments. Boxplot centers represent each median, edges of the boxes represent the 25th and 75th quartiles, whiskers represent the range of the data, and individually plotted points are outliers greater than 1.5 times the interquartile range from the median. b Spearman’s rank correlation of RNA abundance of manually seeded and bioprinted cell line 3D models at three time points (t = 1, 24, and 72 hours post-seeding). We found strong correlations between RNA abundance in manually seeded and bioprinted cells for both cell lines. p-values are derived from a two-tailed test of correlation between paired samples. c Volcano plots of paired, two-tailed t-test results comparing the RNA abundance of manually seeded and bioprinted MCF-7 and BT-474 with unadjusted p-values (left) and false discovery rate (FDR) adjusted p-values (right). No transcripts were preferentially expressed based upon the seeding method for either cell line (n = 0 out of 30,544 genes, FDR < 0.05, t-test). d Distribution of percent spliced in (PSI) exons are similarly distributed among BT-474 (top) and MCF-7 (bottom). The distribution of PSI is similar between manually seeded (left) and bioprinted (right) cells. PSI of 1 indicates that the exon is exclusively included, while a PSI of 0 indicates that the exon is exclusively excluded. Source data is provided as a Source Data file.

