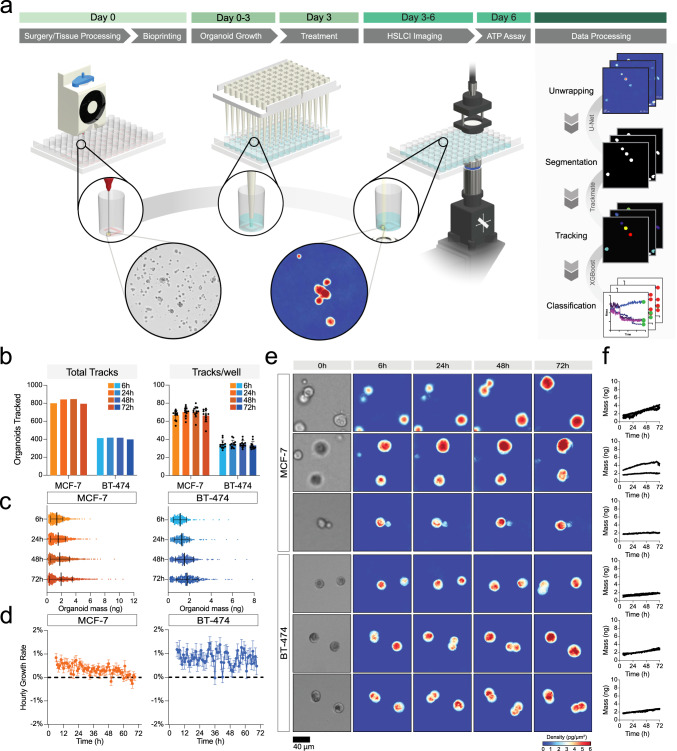
Fig. 3. Bioprinting enables single-organoid tracking with high-speed live cell interferometry.
a General schematic of the pipeline. Extrusion-based bioprinting is used to deposit single-layer Matrigel constructs into a 96-well plate (Day 0). Organoid model establishment and growth (Day 0–3) can be monitored through brightfield imaging. After treatment (Day 3), the well plate is transferred to the high-speed live cell interferometer for phase imaging (Day 3–6). Coherent light illuminates the bioprinted construct and a phase image is obtained. Organoids are tracked up to three days using the HSLCI and changes in organoid mass are measured to observe response to treatment. b Total number of tracks (left) and mean number ± SD of tracks per well (right) for cell clusters from each cell line at four time points (t = 6, 24, 48, and 72 hours after treatment). The total number of tracks across replicate wells treated with vehicle (1% DMSO) was 921 for MCF-7 (n = 12 wells) and 438 for BT-474 (n = 12 wells) c Mass distribution at four time points (t = 6, 24, 48, and 72 hours after treatment). Black bars represent the mean with error bars representing the standard deviation. Mean and standard deviation calculated based on n = 804, 855, 859, 803 for MCF-7 and n = 421, 420, 423, 402 for BT-474 cell clusters at t = 6, 24, 48, and 72 hours, respectively. d Hourly growth rate (percent mass change per hour) of tracked MCF-7 (left) and BT-474 (right) cultured in 1% DMSO. Data presented as mean ± SEM for each hour calculated based on growth rate data for n = 921 MCF-7 and n = 438 BT-474 tracked clusters. e Representative HSLCI-acquired phase images at four time points (t = 6, 24, 48, and 72 hours after treatment). Brightfield images taken immediately before treatment are shown on the left. f Calculated mass of each representative organoid over time. Source data is provided as a Source Data file.

