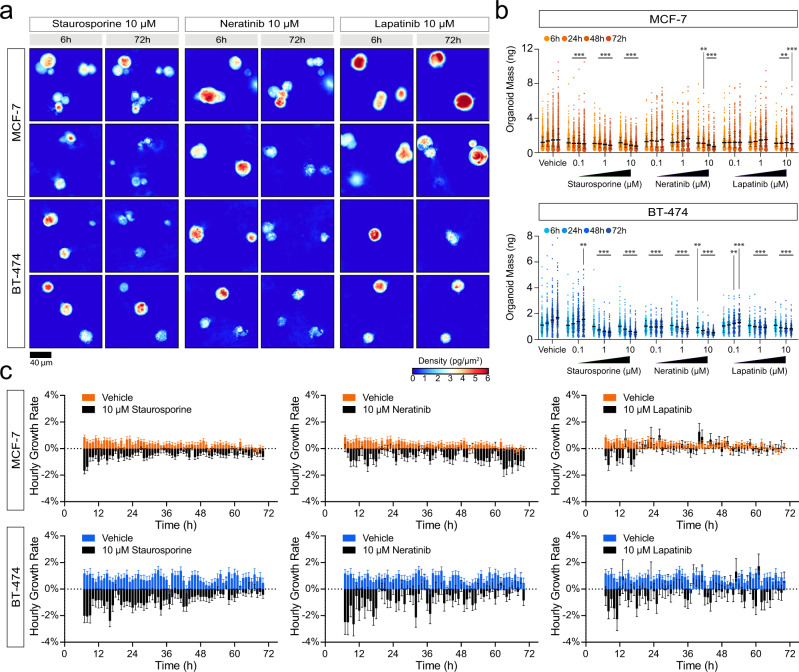
Fig. 4. HSLCI enables high throughput, longitudinal drug response profiling of 3D models of cancer.
a Representative HSLCI-acquired phase images of MCF-7 and BT-474 grown in 3D and treated with 10 µM staurosporine, 10 µM neratinib, and 10 µM lapatinib. b Each bar represents the mass distribution at 6-, 24-, 48-, and 72 hours post-treatment (left to right). Black horizontal bars represent the median with error bars representing the interquartile range of the distribution. Sample sizes, summary statistics, and exact p-values for each condition are available in Supplementary Table 3. Statistical significance was assessed using Kruskal-Wallis tests. For samples with p-values lower than 0.05, we performed two-tailed Mann-Whitney U-tests against the vehicle control at the respective time points. p < 0.05 is denoted by *, p < 0.01 is denoted by **, and p < 0.001 is denoted by ***. c Hourly growth rates, calculated as percent mass change per hour, are compared between organoids treated with 10 µM staurosporine and vehicle, 10 µM neratinib and vehicle, and 10 µM lapatinib and vehicle. Data are presented as mean growth rate ± SEM. Growth rate data is derived from n = 921, 592, 249, and 292 MCF-7 cell clusters and n = 438, 299, 110, and 127 BT-474 clusters treated with the vehicle, 10 µM staurosporine, 10 µM neratinib, and 10 µM lapatinib, respectively. Source data is provided as a Source Data file.

