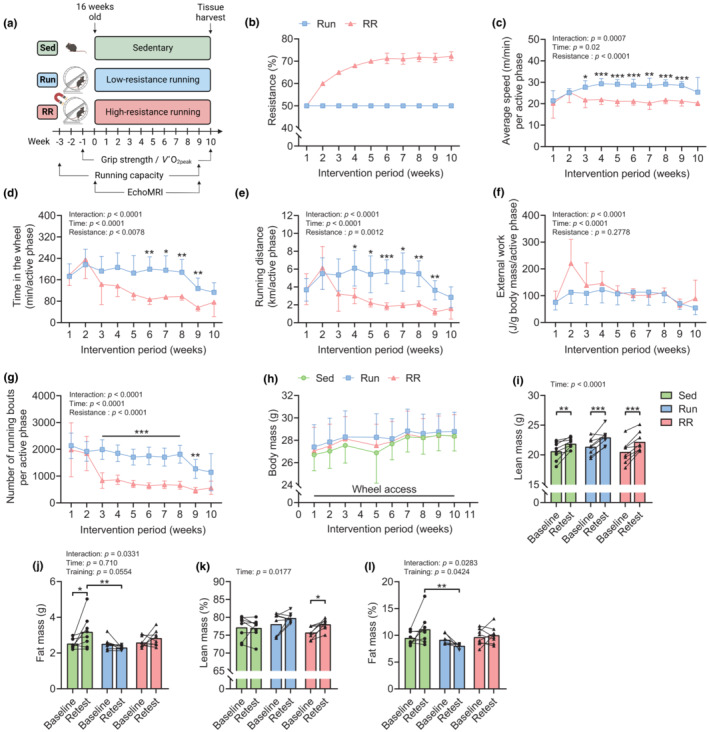
FIGURE 1.

Characterization of the training stimulus provided by Run and RR and their effect on body composition. (a) Graphical illustration of the experimental approach of wheel running interventions and timing of baseline measurements and retests. (b) Average resistance, (c) running speed, (d) time spent in the wheel, (e) running distance, (f) external work, and (g) number of running bouts per active phase throughout the study. (h) Body mass trajectory for all groups from start (Week 1) to the end (Week 10) of the intervention period. (i) Body lean mass, (j) fat mass, (k) body lean mass percentage, and (l) body fat mass percentage at baseline and after 9 weeks. Data are presented as mean ± SD (b–h), mean and individual paired values connected with a black line (i–l), n = 8 for all datasets. Two‐way repeated‐measure ANOVAs followed by Sidak's or Tukey's post hoc tests (c–l). *p < 0.05, **p < 0.01, ***p < 0.001. Scheme in (a) was created with BioRender.com.
