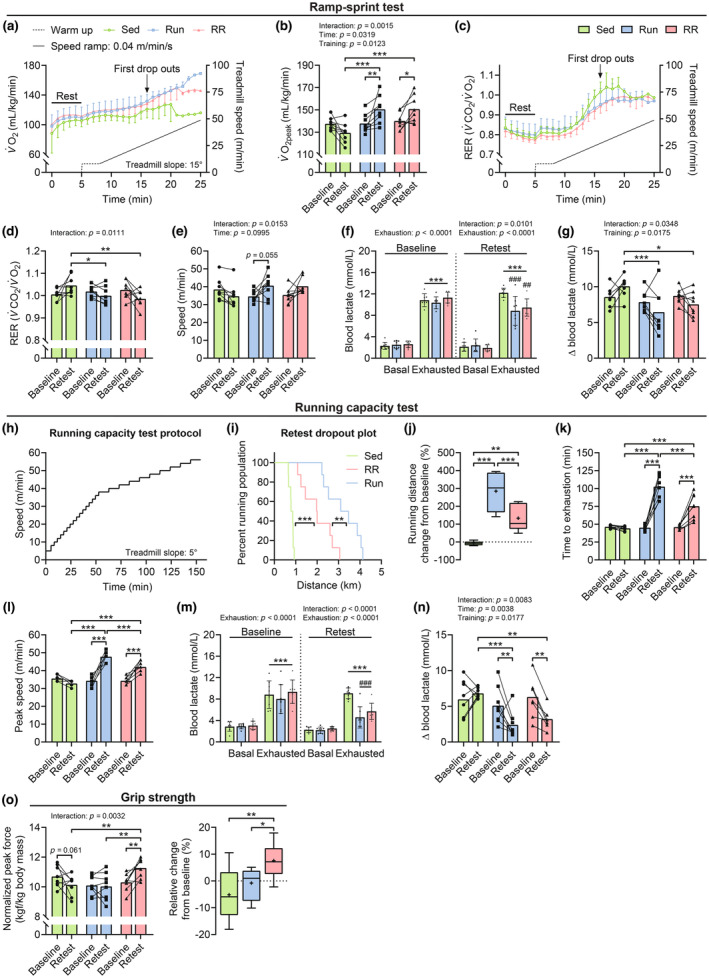
FIGURE 2.

Training‐induced adaptations in oxygen consumption rates, running performance, and grip strength. Indirect calorimetry measurements at rest and during a ramp‐sprint protocol on a closed treadmill system with a 15° slope: (a) O2 consumption rates and (c) RER (V̇CO2/V̇O2) as a function of speed. (b) Peak oxygen uptake (V̇O2peak), (d) RER, and (e) speed values at V̇O2peak at baseline and after 10 weeks (Retest) of the intervention. (f) Blood lactate levels before (Basal) and directly after (Exhausted) the ramp‐sprint test and (g) expressed as the difference exhausted‐basal (Δ) at baseline and after 10 weeks (Retest). (h) Incremental step protocol used to asses running performance: (i) Kaplan–Meier plot of distance covered in the retest, (j) change from baseline in the running distance in percent. (k) Time to exhaustion (min) and (l) peak speed (m min−1) at baseline and after 9 weeks (Retest). (m) Blood lactate levels before (Basal) and after (Exhausted) the running capacity test and (n) expressed as the difference exhausted‐basal (Δ) at baseline and after 9 weeks (Retest). (o) Normalized in vivo muscle force estimated by measuring the peak force (kgf, kilogram‐force) of the whole limb grip (left panel) and relative change from baseline (right panel). Data are presented as mean ± SD (a, c, f, m), mean and individual paired values connected with a black line (b, d, e, g, k, l, o), or as Tukey's box and whisker plots (j, o). For all datasets, n = 8 except for Sed in (f, g) where one data point was removed at “baseline‐exhausted” due to a technical error. Two‐way repeated‐measure ANOVAs followed by Sidak's or Tukey's post hoc tests (b, d–g, k–o), Mantel‐Cox log‐rank (i), and one‐way ANOVA with Fisher's LSD (j and right panel in n). *p < 0.05, **p < 0.01, ***p < 0.001, ## p < 0.01, and ### p < 0.01 Sed vs. Run or RR of the same time point.
