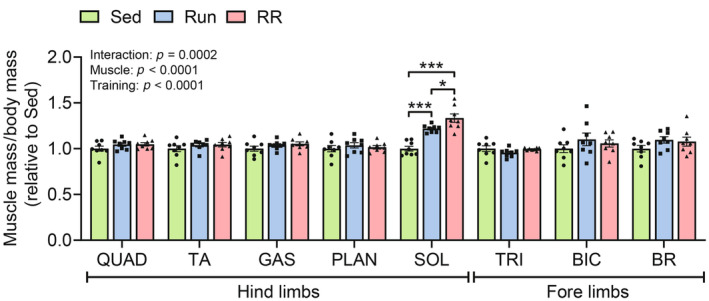
FIGURE 3.

Changes in individual muscle masses. Masses of various fore and hind limb muscles expressed as fold change relative to Sed after normalization to body mass (n = 8). QUAD, M. quadriceps femoris; TA, M. tibialis anterior; SOL, M. soleus; GAS, M. gastrocnemius; PLAN, M. plantaris; TRI, M. triceps brachii; BIC, M. biceps brachii and BR, M. brachio radialis. Data are presented as mean ± SD including individual values. Two‐way ANOVA followed by Tukey's post hoc test. *p < 0.05, ***p < 0.001.
