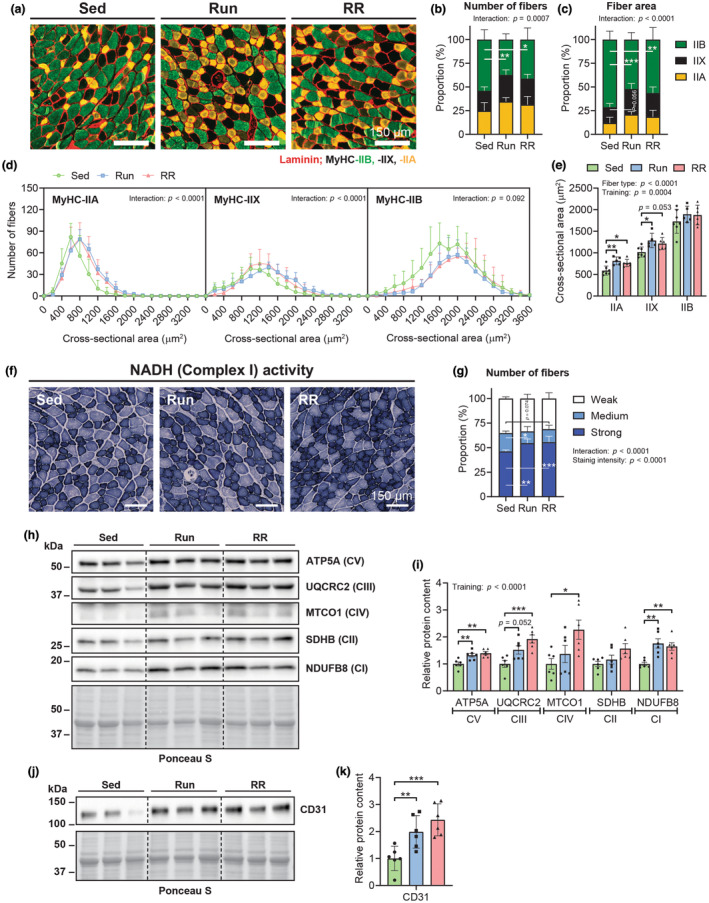
FIGURE 4.

Cellular and molecular adaptations of the M. plantaris following Run and RR. (a) Representative magnifications of whole‐muscle cross‐sectional images from the M. plantaris stained with antibodies against MyHC‐IIA (yellow), ‐IIB (green) as well as laminin (red), while fibers without staining were classified as MyHC‐IIX. Quantification of the MyHC‐isoform‐based fiber‐type distribution as a proportion of (b) the total number of fibers and (c) the total cross‐sectional area (CSA) occupied by fibers. (d) Frequency histograms for the individual fiber types display the number of fibers that had the indicated CSA (μm2). (e) Mean CSA of MyHC‐IIA, ‐IIX, and ‐IIB fibers. (b–e) Sed, n = 7; Run, n = 5; RR, n = 6. (f) Representative images of NADH enzyme activity staining and (g) resulting proportion of fibers quantified as fibers showing weak, medium, or strong NADH activity (Sed, n = 6; Run, n = 5; RR, n = 6). Western blots of mitochondrial respiratory chain complexes (c) I–V (h) and endothelial cell marker CD31 (j) along with the band quantifications of two blots per protein target (i and k) (n = 6). Data are presented as mean ± SD including individual values where indicated. Two‐way ANOVAs with Tukey's post hoc test (b–e, g and i) and one‐way ANOVA with Fisher's LSD in (k). *p < 0.05, **p < 0.01, ***p < 0.001.
