FIGURE 5.

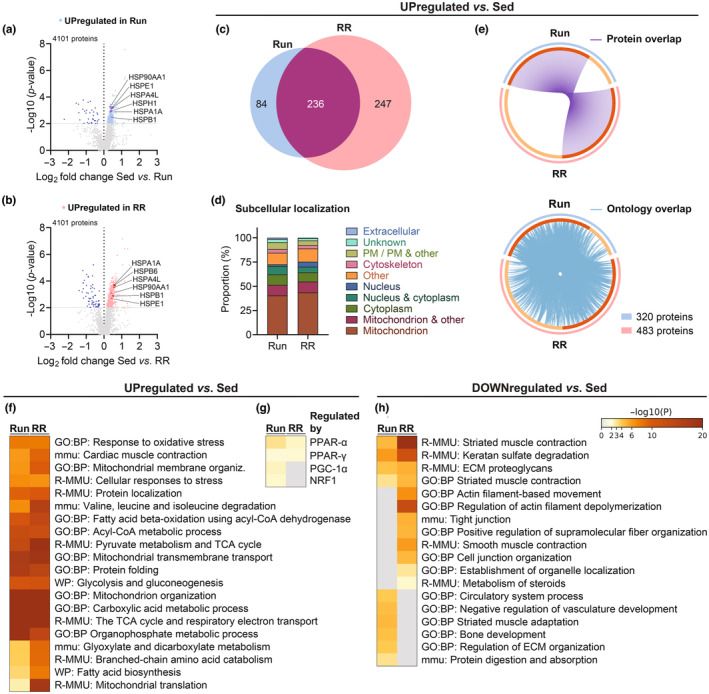
Proteomic adaptations of the M. plantaris. (a, b) Volcano plots showing the differentially regulated proteins in Run and RR compared to sedentary mice. (c) Venn's diagram showing the overlap between upregulated (p unadjusted < 0.01) proteins in Run and RR compared to Sed along with (d) their UniProt‐based subcellular localization (PM: plasma membrane) and (e) Circos plots connecting the same proteins (purple lines) or proteins belonging to the same ontology term (blue lines). Heatmaps generated with Metascape showing (f) the top enriched ontology terms of upregulated proteins and (g) transcription factors/coregulators regulating these proteins as well as (h) top enriched ontology terms of significantly (p unadjusted < 0.01) downregulated proteins. n = 4 for all datasets.
