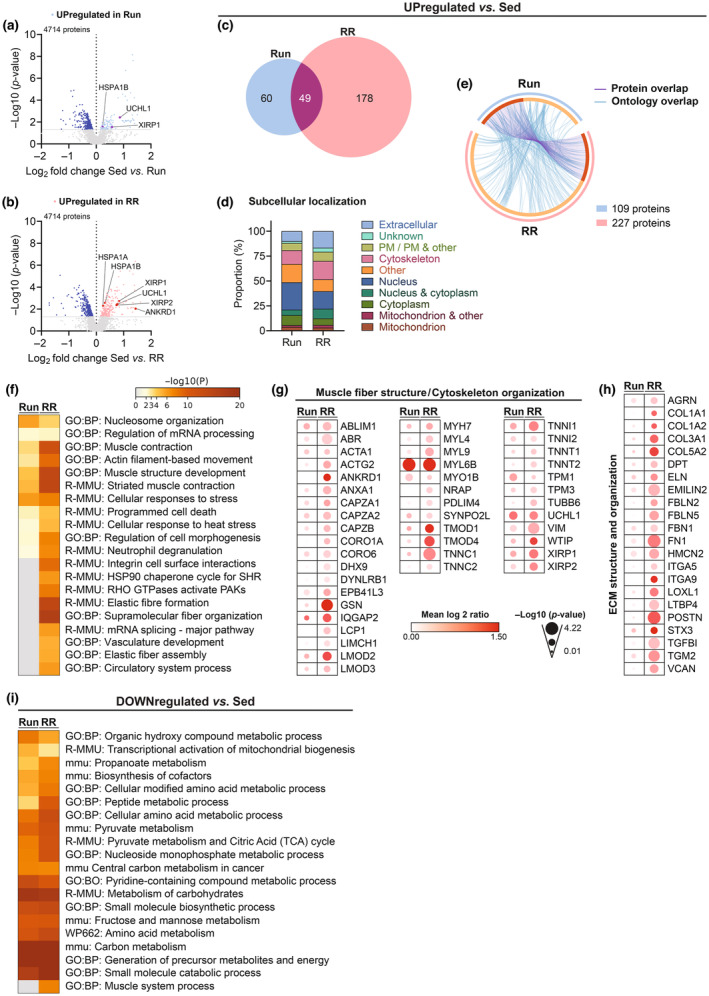
FIGURE 7.

Proteomic adaptations of the M. soleus. (a, b) Volcano plots showing the differentially regulated proteins in Run and RR compared to sedentary mice. (c) Venn's diagram showing the overlap between upregulated (p unadjusted < 0.05) proteins in Run and RR compared to Sed along with (d) their UniProt‐based subcellular localization (PM: plasma membrane) and (e) Circos plot connecting same proteins (purple lines) or proteins belonging to the same ontology term (blue lines). (f) Heatmap generated by Metascape showing the top enriched ontology terms of the upregulated proteins. Relative protein expression of selected proteins detected with TMT‐LC‐MS/MS involved in (g) Muscle fiber structure/cytoskeleton organization and (h) Extracellular matrix (ECM) structure and organization. (i) Heatmap generated by Metascape showing the top enriched ontology terms of significantly (p unadjusted < 0.05) downregulated proteins in Run and RR. n = 4 for all datasets.
