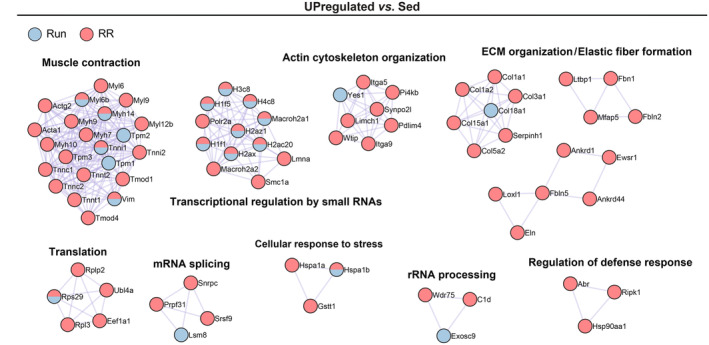
FIGURE 8.

Protein–protein interaction networks of enriched proteins of Run and RR M. soleus. Metascape‐based protein–protein interaction enrichment analysis of significantly (p unadjusted < 0.05) upregulated proteins in M. soleus of Run and RR compared to Sed. Displayed are the most densely connected networks with their individual components and functional description. n = 4 for all datasets.
