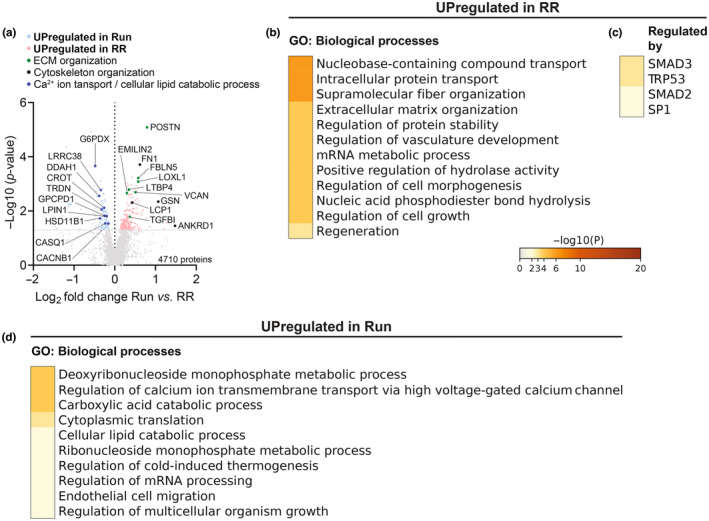
FIGURE 9.

Direct comparison between Run and RR of TMT‐LC‐MS/MS detected proteins of the M. soleus. (a) Volcano plot showing differentially regulated proteins of Run compared to RR (n = 4), light blue and salmon mark proteins upregulated (p unadjusted < 0.05) in Run or RR, respectively. Selected proteins are labeled and colored according to the indicated functions. Metascape's top GO: Biological processes of the upregulated proteins in (b) RR and (d) Run along with transcription factors predicted to regulate the enriched proteins in RR in (c).
